Abstract
Stress accumulation and release reflected by acoustic emissions (AEs) during shearing of granular materials provide important information on failure mechanisms in seismic faults and landslides controlled by stick-slip.
Among many characteristics (amplitude, energy, counts, and frequency) of AE signals generated by stick-slip, stress changes corresponding to various frequency AEs in different stages of the stickslip process are not clear, which limits our knowledge of the characteristics of precursory signals before stickslip failure.
To better understand the physical mechanisms of granular stick-slip, we monitored the mechanical and AE signals using high-frequency ($2 \text{MHz}$) synchronous acquisition during constant-speed shear of packs of uniform glass beads with different sizes at different normal stresses.
颗粒材料剪切过程中的声发射(AEs)所反映的应力积累和释放,为研究地震断层和滞滑控制的滑坡的破坏机制提供了重要信息。
在滞滑产生的声发射信号的众多特征(振幅、能量、计数和频率)中,与滞滑过程不同阶段的各种频率声发射相对应的应力变化尚不清楚,这限制了我们对滞滑破坏前先兆信号特征的了解。
为了更好地理解颗粒滞滑的物理机制,我们使用高频($2 \text{MHz}$)同步采集技术在不同法向应力下对不同尺寸的均匀玻璃珠堆积进行恒速剪切时监测机械和声发射信号。
The release rate of AE energy was found to accelerate with the dilatation of the sample volume, and the stress drop of stick-slip was augmented with the increase of normal stress and particle size.
Three characteristic events of single cycle stick-slip were observed in this study: main slip, minor slip, and microslip. We analyzed the AE frequency spectra of these three event types.
研究发现,随着样品体积的膨胀,声发射能量的释放速度加快,并且随着法向应力和颗粒尺寸的增加,滞滑的应力下降幅度增大。
本研究观察到单循环滞滑的三个特征事件: 主滑移、次滑移和微滑移。我们分析了这三种事件的声发射频谱。
Both main slip and minor slip corresponded to stress drop and generated high-frequency AEs (about several hundred $\text{kHz}$), while the AE frequencies generated by microslip were lower (about tens of $\text{kHz}$) and exhibited stress strengthening, which were not apparent in previous studies due to the low frequency of acquisition.
We propose that the microslip is mainly due to sliding on grain contacts, while the main slip and minor slip resulted from breakage and reforming of force chains. Low-frequency AEs from microslip may suggest a crucial precursor of seismic faults and landslides.
主滑移和次滑移都与应力下降相对应,并产生高频声发射(约几百 $\text{kHz}$),而微滑移产生的声发射频率较低(约几十 $\text{kHz}$),并表现出应力增强,这在以前的研究中由于采集频率较低而不明显。
我们认为,微滑动主要是由于颗粒接触上的滑动,而主滑动和小滑动则是由于力链的断裂和重组。微滑动产生的低频 AE 可能是地震断层和滑坡的重要前兆。
Introduction
The shear behavior of granular materials is important in the evolution of fault ruptures and landslides (Marone, 1998; Melosh, 1996; S. B. Savage & Hutter, 1989; Scholz, 2002).
Brace and Byerlee (1966) proposed stick-slip as a significant mechanism for earthquakes. Stick-slip is also widely recognized as a representative feature of the shear behavior of granular materials (Marone, 1998).
颗粒材料的剪切行为对断层破裂和山体滑坡的演变非常重要(Marone,1998 年;Melosh,1996 年;S. B. Savage & Hutter,1989 年;Scholz,2002 年)。
Brace 和 Byerlee(1966 年)提出滞滑是地震的重要机制。滞滑也被广泛认为是颗粒材料剪切行为的一个代表性特征(Marone,1998 年)。
Field observation reveals that granular stick-slip manifests in the form of quasi-periodic sliding of seismic faults (Kato et al., 2012; Rivet et al., 2011; Yarai & Ozawa, 2013).
Laboratory experiments show that this stick-slip effect is affected by many factors to varying degrees, such as shear speed (Di Toro et al., 2011; Wang et al., 2010), vibrational waves (Johnson et al., 2008, 2016; Krim et al., 2011), humidity (Scuderi et al., 2014), grain size (Anthony & Marone, 2005), stiffness (Leeman et al., 2015), and layer thickness (Lyu et al., 2019).
实地观测表明,颗粒滞滑表现为地震断层的准周期性滑动(Kato 等人,2012 年;Rivet 等人,2011 年;Yarai 和 Ozawa,2013 年)。
实验室研究表明,这种滞滑效应在不同程度上受到许多因素的影响,如剪切速度(Di Toro 等人,2011 年;Wang 等人,2010 年)、振动波(Johnson 等人,2008 年,2016 年;Krim 等人,2011 年)、湿度(Scuderi 等人,2014 年)、颗粒尺度(Anthony 和 Marone,2005 年)、刚度(Leeman 等人,2015 年)和层厚度(Lyu 等人,2019 年)。
Decades of seismological observations have highlighted the variability of foreshock occurrence prior to natural earthquakes, making thus difficult to track how earthquakes start.
Before the occurrence of an earthquake, slip initially develops on a localized, slowly growing zone, whose process of formation was defined as the nucleation (Ampuero & Rubin, 2008; Rubin & Ampuero, 2005; Scholz, 1998; Uenishi & Rice, 2003).
A sequence of small slip events called microslips occur during the nucleation stage (Ferdowsi et al., 2013). Johnson et al. (2013) monitored the acoustic signals when microslips occurred and proposed that acoustic emission (AEs) and microslips demonstrated a strong correlation.
数十年的地震学观测表明,天然地震发生前的前震变化多端,因此很难追踪地震是如何开始的。
在地震发生之前,滑动最初发生在一个局部的、缓慢增长的区域,其形成过程被定义为成核(Ampuero & Rubin, 2008; Rubin & Ampuero, 2005; Scholz, 1998; Uenishi & Rice, 2003)。
在成核阶段会发生一系列称为微滑动的小型滑动事件(Ferdowsi 等人,2013 年)。Johnson 等人(2013 年)监测了微滑动发生时的声学信号,并提出声发射 (AE) 与微滑动具有很强的相关性。
The use of AEs during the nucleation stage as a microslip precursor to stick-slip failure has been recognized by many studies (Jiang et al., 2017; Ostapchuk & Morozova, 2020; Scuderi et al., 2016).
The presence of microslips was also detected in field monitoring (Dodge et al., 1996; Kato et al., 2012) and in numerical simulation (Ferdowsi et al., 2013; Griffa et al., 2012). Microslip exhibited an exponential increase in rate of occurrence, culminating in stick-slip failure (Johnson et al., 2013).
许多研究(Jiang 等人,2017 年;Ostapchuk & Morozova,2020 年;Scuderi 等人,2016 年)都认识到,成核阶段的 AE 是导致滞滑破坏的微滑动前兆。
在现场监测(Dodge 等人,1996 年;Kato 等人,2012 年)和数值模拟(Ferdowsi 等人,2013 年;Griffa 等人,2012 年)中也发现了微滑移的存在。微滑动的发生率呈指数增长,最终导致滞滑破坏(Johnson 等人,2013 年)。
But there are few studies on the mechanical contribution of microslips to the upcoming stick-slip failure. Ferdowsi et al. (2013) and Johnson et al. (2013) considered that microslip was micro failure.
However, Marty et al. (2021) proposed that precursory AEs during the nucleation stage was an almost fully aseismic process. However, because of the limitations of acquisition frequency, the fundamental mechanisms that govern the occurrence of microslips were still controversial and direct monitoring of the mechanical variation (stress strengthening or stress drop) of microslips was still missing.
但有关微滑动对即将发生的滞滑破坏的机械贡献的研究却很少。Ferdowsi 等人(2013 年)和 Johnson 等人(2013 年)认为微滑动是微破坏。
不过,Marty 等人(2021 年)提出,成核阶段的前兆声发射几乎是一个完全无震过程。然而,由于采集频率的限制,关于微裂缝发生的基本机制仍存在争议,对微移机械变化(应力增强或应力下降)的直接监测也仍然缺失。
The fundamentals of granular stick-slip have been gradually unified in past decades as a change in the structure of force chains caused by fluctuations in internal stresses, accompanied by release of elastic waves (Anthony & Marone, 2005; Biegel et al., 1989).
With the development of monitoring techniques, these elastic waves can be detected by AE techniques. Many studies analyzed the characteristics of AEs (including energy, amplitude, and the occurrence rate of AEs) during granular stick-slip (Aharonov & Sparks, 2004; Davies et al., 2012; Michlmayr et al., 2012, 2013; Ostapchuk & Morozova, 2020).
在过去的几十年中,颗粒滞滑的基本原理逐渐被统一为由内应力波动引起的力链结构变化,并伴随着弹性波的释放(Anthony 和 Marone,2005 年;Biegel 等人,1989 年)。
随着监测技术的发展,这些弹性波可以通过声发射技术检测到。许多研究分析了颗粒滞滑过程中的声发射特性(包括能量、振幅和声发射发生率)(Aharonov 和 Sparks,2004 年;Davies 等人,2012 年;Michlmayr 等人,2012 年,2013 年;Ostapchuk 和 Morozova,2020 年)。
Particularly, AE frequency can reflect the stick-slip mechanism and was widely used in the study of rock stick-slip. In stick-slip experiments with rock friction, when stickslip failure occurs, the AE frequency generated can be as high as $400–1,000 \text{kHz}$ (Marty et al., 2019; McLaskey & Lockner, 2014; McLaskey et al., 2012; Sellers et al., 2003).
However, few studies have focused on the AE frequency of microslip during the nucleation stage. Analysis of the differences in AE frequency between microslip and stick-slip failure is still lacking.
Accurate identification of AEs corresponding to microslip in field monitoring can be used to significantly improve the possibility of predicting earthquakes.
尤其是声发射频率可以反映滞滑机制,在岩石滞滑研究中得到广泛应用。在岩石摩擦条件下的滞滑实验中,当发生滞滑破坏时,产生的声发射频率可高达 $400–1,000 \text{ kHz}$(Marty 等人,2019 年;McLaskey & Lockner,2014 年;McLaskey 等人,2012 年;Sellers 等人,2003 年)。
然而,很少有研究关注成核阶段微滑动的声发射频率。关于微滑动和滞滑破坏之间声发射频率差异的分析仍然缺乏。
在现场监测中准确识别与微滑相对应的声发射,可以大大提高预测地震的可能性。
Here, we acquired the mechanical and AE signals of ring shear experiments with glass bead packs, simultaneously with a high acquisition rate ($2\text{ MHz}$) and we analyzed changes in AE frequency spectra during stick-slip events.
We focused on single cycle stick-slip and we found that higher frequency AEs (several hundred $\text{kHz}$) corresponded to a significant stress drop (stick-slip failure) and lower frequency AEs (about tens of $\text{kHz}$) corresponded to stress-strengthening (microslip).
在此,我们以高采集率($2\text{ MHz}$)同时采集了玻璃珠堆积环剪实验的机械和 AE 信号,并分析了滞滑事件发生时 AE 频率谱的变化。
我们重点研究了单周期滞滑现象,发现频率较高的 AE(几百 $\text{ kHz}$)与应力大幅下降(滞滑失效)相对应,而频率较低的 AE(约几十 $\text{ kHz}$)则与应力加强(微滑)相对应。
Materials and Methods
A series of experiments were carried out using a servo-hydraulic controlled ring shear device (apparatus of ring shear (ARS) ring shear made by Wille Geotechnik, Germany), which enabled us to avoid the limitation of cumulative shear displacement within a certain range of normal stress and shear speed (Jiang et al., 2016, 2017; Korkolis et al., 2021).
The apparatus is made of stainless steel and the rotating cavity has an inner diameter of $50 \text{ mm}$, an outer diameter of $100 \text{ mm}$, and a maximum height of $25 \text{ mm}$.
我们使用液压伺服控制的环形剪切装置(德国 Wille Geotechnik 公司制造的环形剪切装置(ARS))进行了一系列实验,从而避免了在一定法向应力和剪切速度范围内累积剪切位移的限制(Jiang 等人,2016 年,2017 年;Korkolis 等人,2021 年)。
仪器由不锈钢制成,旋转腔的内径为 $50$ 毫米,外径为 $100$ 毫米,最大高度为 $25$ 毫米。
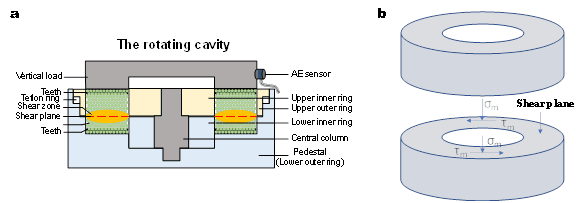
This ARS ring shear has a maximum shear speed of $120 \text{ mm/min} (3.33 \times 10^{−8} \text{m/s})$ and a maximum normal stress of $1,500\text{ kPa}$. The loading components of the ring shear and the position of each sensor are shown in Figures 1a and 1c.
Details of the rotating cavity in Figure 1a are shown in Figure 1b. There is a gap set between the two annular cavities as a shear plane. A Teflon ring is set between the upper outer ring and the lower outer ring to reduce the shear stresses borne by the friction of the upper and lower rings.
这种 ARS 环形剪切机的最大剪切速度为 $120 \text{ mm/min} (3.33 \times 10^{-8} \text{ m/s})$ ,最大法向应力为 $1,500 \text{ kPa}$ 。图 1a 和图 1c 显示了环形剪切力的加载分量和每个传感器的位置。
Based on this design, the shear plane became a theoretical surface of maximum shear stress. We assumed that a shear zone of granular material would form near the set stress concentration plane (shear plane) because of shear localization (Desrues, 1990; Desrues & Andó, 2015).
The 3D structure of the shear box and the assembly process of the rotating cavity are shown in Figure S1 in Supporting Information S1.
根据这一设计,剪切面成为最大剪切应力的理论面。我们假定,由于剪切局域化(Desrues,1990;Desrues & Andó,2015),颗粒材料的剪切区将在设定的应力集中面(剪切面)附近形成。
剪切盒的三维结构和旋转空腔的组装过程见佐证资料 S1 中的图 S1。
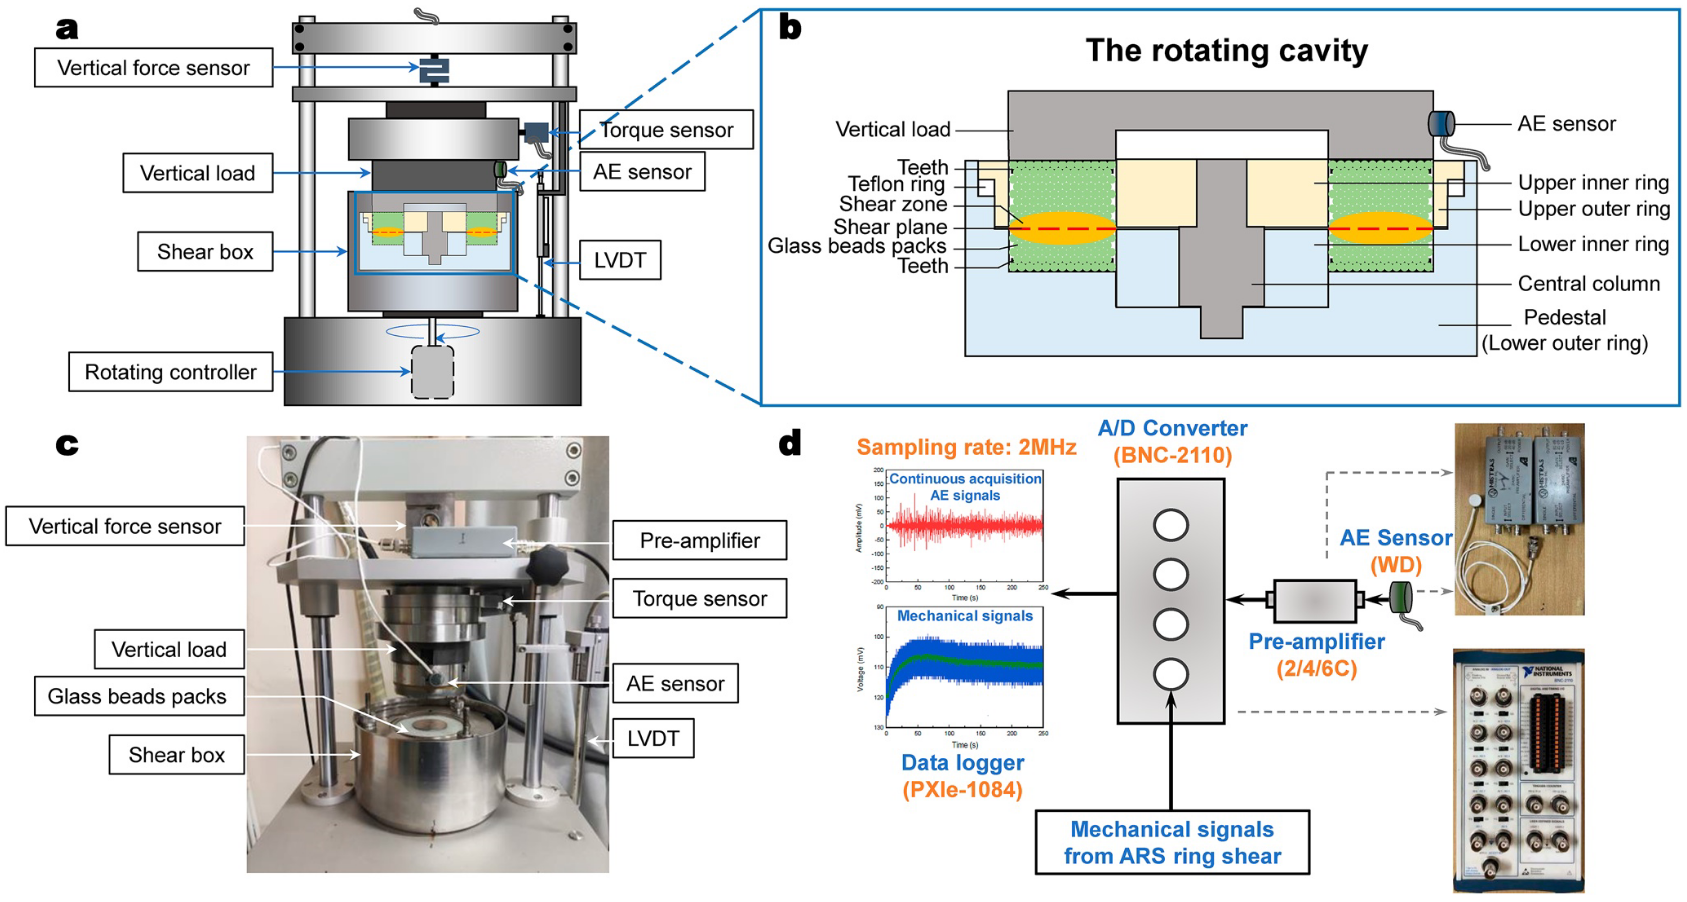
(a) A section of the ARS ring shear apparatus. (b) A section of the rotating cavity in the shear box. (c) Photo of the ring-shear apparatus with the acoustic emission (AE) acquisition configuration. (d) Schematic illustration of the synchronization of both continuous acquisition AE signals (red graph) and mechanical signals (blue graph): continuous acquisition AE signals were collected by a WD-type AE sensor and were amplified by a 2/4/6C type pre-amplifier; The BNC-2110 type A/D converter synchronized the mechanical and amplified AE signals, and the PXle-1084 type NI system collected both signals at a sampling rate of $2\text{ MHz}$.
(a) ARS 环形剪切装置的剖面图。 (b) 剪切箱中旋转空腔的剖面图。 (c) 采用声发射(AE)采集配置的环形剪切仪器照片。 (d) 连续采集 AE 信号(红图)和机械信号(蓝图)的同步示意图:连续采集 AE 信号由 WD 型 AE 传感器采集,并由 2/4/6C 型前置放大器放大;BNC-2110 型 A/D 转换器同步机械信号和放大的 AE 信号,PXle-1084 型 NI 系统以 $2\text{ MHz}$ 的采样率采集这两种信号。
We used uniform glass beads packs to study granular stick-slip because they exhibit significant stick-slip behavior and produce clear AE signals at room temperature.
Furthermore, uniform glass beads allow a more universal granular stickslip mechanism to be obtained by excluding the effects of particle lithology, shape and gradation on stick-slip behavior and they are widely used in laboratory stick-slip studies (Jiang et al., 2016, 2017; Johnson et al., 2008, 2012, 2013; Johnson and Jia., 2005; Leeman et al., 2014; Mair et al., 2002; Nicholas et al., 2012; Ostapchuk & Morozova, 2020; H. M. Savage & Marone, 2007, 2008; Weeks et al., 1991).
我们使用均匀的玻璃球堆积来研究颗粒滞滑,因为它们表现出明显的滞滑行为,并能在室温下产生清晰的 AE 信号。
此外,均匀玻璃珠可以排除颗粒岩性、形状和级配对滞滑行为的影响,从而获得更普遍的颗粒滞滑机理,并被广泛应用于实验室滞滑研究(Jiang 等,2016,2017;Johnson 等,2008,2012,2013;Johnson 和 Jia,2005;Leeman 等,2014;Mair 等,2002;Nicholas 等,2012;Ostapapa 等,2005)、2016、2017;Johnson 等人,2008、2012、2013;Johnson 和 Jia,2005;Leeman 等人,2014;Mair 等人,2002;Nicholas 等人,2012;Ostapchuk & Morozova,2020;H. M. Savage & Marone,2007、2008;Weeks 等人,1991)。
原来在这里就已经提出了有关于研究级配(gradation)的想法了吗?
Uniform glass beads also allow simple, accurate analysis of changes in grain morphology (Rossi et al., 2007; Scuderi et al., 2014, 2015).
Finally, spheres are commonly used in numerical simulations, which is the focus of ongoing work (Ferdowsi, Griffa, Guyer, Johnson, & Carmeliet, 2014; Ferdowsi, Griffa, Guyer, Johnson, Marone, Carmeliet, 2014).
The shear experiments on glass beads packs were carried out with an IC-Type ring shear configuration (Bishop et al., 1971) at a constant shear speed of $3 \text{ mm/min} (0.05\text{ m/s})$ (experience shows we get most obvious stick-slip behavior under this speed condition for an ARS ring shear).
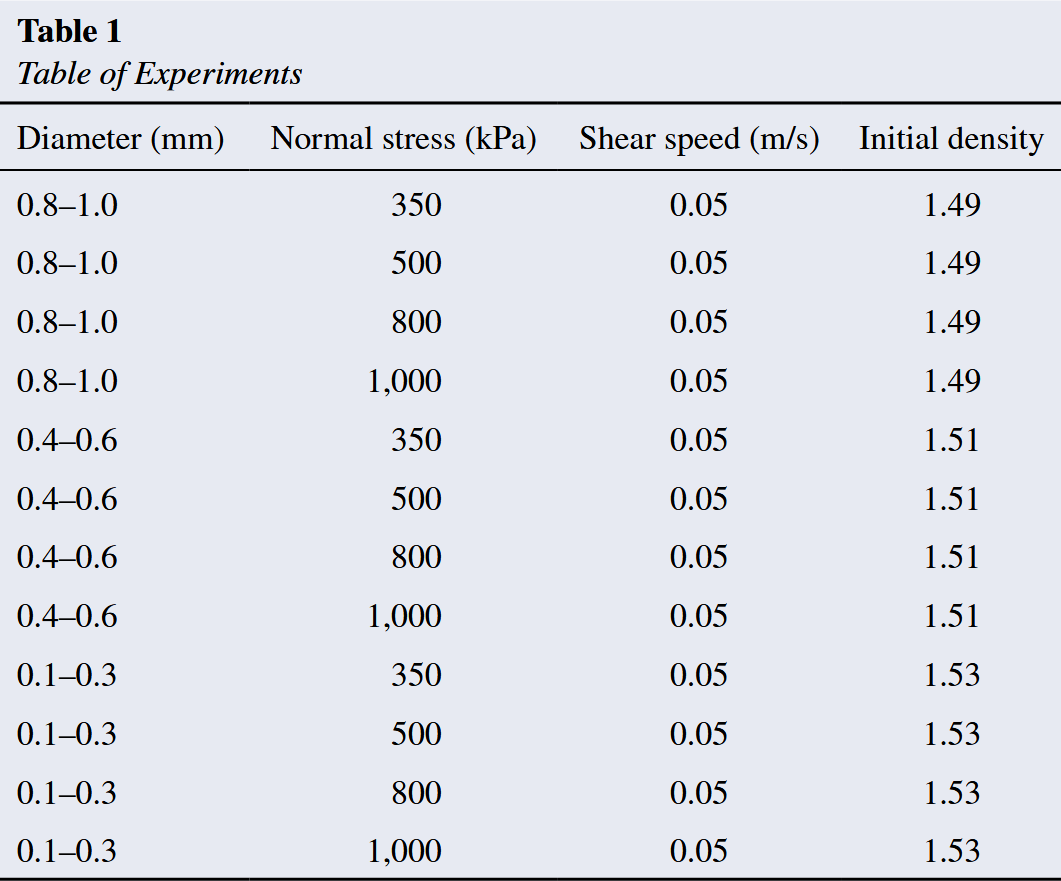
We chose three different particle sizes of glass beads (diameter $\phi = 0.8–1.0, 0.4–0.6$, and $0.1–0.3\text{ mm}$) and four different normal stresses ($350, 500, 800$, and $1,000\text{ kPa}$). Detailed experimental information is shown in Table 1. The experimental process is shown in Movie S1.
均匀的玻璃珠还能简单、准确地分析颗粒形状的变化(Rossi 等人,2007 年;Scuderi 等人,2014 年、2015 年)。
最后,球体常用于数值模拟,这也是当前工作的重点(Ferdowsi, Griffa, Guyer, Johnson, & Carmeliet, 2014; Ferdowsi, Griffa, Guyer, Johnson, Marone, Carmeliet, 2014)。
玻璃珠堆积的剪切实验采用 IC 型环形剪切构型(Bishop 等人,1971 年),剪切速度恒定为 $3 \text{ mm/min} (0.05 \text{ m/s})$(经验表明,在此速度条件下,ARS 环形剪切的滞滑行为最为明显)。
我们选择了三种不同粒径的玻璃珠(直径分别为 $0.8-1.0$、$0.4-0.6$ 和 $0.1-0.3 \text{ mm}$)和四种不同的法向应力($350$、$500$、$800$ 和 $1,000 \text{ kPa}$)。详细实验信息见表 1。实验过程见影片 S1。
In addition, both continuous acquisition and acquisition triggered by AEs were chosen in this study. Continuous acquisition AE signals collected by the NI system (National Instrument Company, USA, NI compact DQA, PXle1084 & BNC-2110) and triggered AE signals were collected by Micro-II Express-8 Digital AE System (Physical Acoustics Corporation, USA).
此外,本研究还选择了连续采集和 AE 触发采集两种方式。连续采集 AE 信号由 NI 系统(美国国家仪器公司,NI compact DQA、PXle1084 和 BNC-2110)采集,触发 AE 信号由 Micro-II Express-8 数字 AE 系统(美国物理声学公司)采集。
For two AE sensors (WD type, $\varphi\quad 18 \times 17\text{ mm}$, the maximum frequency of the AE signal that can be captured [Peak Frequency] is $900 \text{kHz}$, Physical Acoustics Corporation, USA) were installed near the shear zone. AE signals were amplified by a pre-amplifier (2/4/6C type, Peak Frequency $= 1,200 \text{ kHz}$, Physical Acoustics Corporation, USA).
Both AE and mechanical signals were connected to a high-speed sampling module with four isolated channels (BNC-2110), and thus the two kinds of input signals can be simultaneously sampled and recorded. Under these conditions, AE and mechanical signals can be acquired simultaneously by the same hardware with a maximum acquisition frequency of $2\text{ MHz}$ (Figure 1d). The detailed method of simultaneous acquisition in this study is shown in Figure S2 in Supporting Information S1.
在剪切带附近安装了两个 AE 传感器(WD 型,$18 \times 17\text{ mm}$,可捕获的 AE 信号的最大频率[峰值频率]为 $900 \text{kHz}$,美国物理声学公司)。AE 信号由前置放大器(2/4/6C 型,峰值频率 $= 1,200 \text{kHz}$,美国物理声学公司)放大。
AE 信号和机械信号都被连接到一个具有四个隔离通道的高速采样模块(BNC-2110)上,因此可以同时对两种输入信号进行采样和记录。在这种条件下,AE 信号和机械信号可由同一硬件同时采集,最高采集频率可达 $2 \text{MHz}$(图 1d)。本研究中同步采集的详细方法见佐证资料 S1 中的图 S2。
Results
Characteristics of Mechanical Data and AE Signals
We used the ring-shear device to shear glass beads ($\varphi = 0.8–1.0\text{ mm}$) under different normal stress conditions recording shear resistance, vertical displacement, AE amplitude and accumulated AE energy at increasing shear displacements. The calculation of shear resistance (shear stress) of samples on the ARS ring shear in this study is shown in Figure S3 in Supporting Information S1.
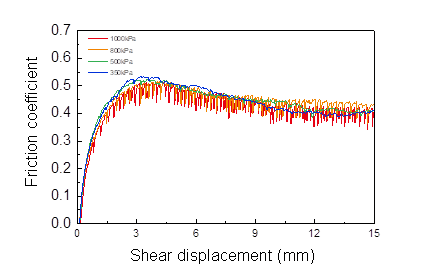
We divided shear resistance by normal stress to calculate the friction coefficient of the sample. The sample exhibited different degrees of stick-slip behavior with the shear process under different normal stress conditions, but the calculated friction coefficients with shear displacement were basically the same:
they all increased to a certain peak value, before decreasing to a relatively stable residual value (Figures 2a, 2d, 2g, and 2j).
The friction coefficient as a function of shear displacement is shown in Figure S4 in Supporting Information S1.
我们使用环剪装置在不同法向应力条件下剪切玻璃珠($\varphi = 0.8–1.0\text{ mm}$),记录剪切位移增加时的剪切阻力、垂直位移、AE 振幅和累积 AE 能量。本研究中样品在 ARS 环形剪切器上的剪切阻力(剪切应力)计算结果见佐证资料 S1 中的图 S3。
我们用剪切阻力除以法向应力来计算样品的摩擦系数。在不同的法向应力条件下,样品在剪切过程中表现出不同程度的滞滑行为,但计算出的摩擦系数与剪切位移的关系基本相同:
都是先增大到某个峰值,然后再减小到一个相对稳定的残值(图 2a、2d、2g 和 2j)。
摩擦系数与剪切位移的函数关系见佐证资料 S1 中的图 S4。
这里求摩擦系数实际上更应该理解为归一化的操作, 摩擦系数只是一种更容易理解的物理含义
From the variation in vertical displacement, it can be inferred that the sample volume behaved with first shear contraction, then shear dilatation, and finally stabilized when the sample had reached residual strength. The relationships between continuous acquisition AE amplitude and shear displacement were collected by NI system (Figures 2b, 2e, 2h, and 2k).
The AE amplitude of the whole shear process (AE waveform) showed a similar AE signal result under four normal stresses ($350$, $500$, $800$, and $1,000\text{ kPa}$): from the beginning of shear until reaching the residual state; the AE signal behaved as a “spindle” like shape and generated an energy burst at the peak strength; after entering the critical state (stage III in Figure 2), the AE signal tended to stabilize.
从垂直位移的变化可以推断出,样品体积先是剪切收缩,然后是剪切膨胀,最后在样品达到残余强度后趋于稳定。NI 系统收集了连续采样的 AE 振幅与剪切位移之间的关系(图 2b、2e、2h 和 2k)。
整个剪切过程的 AE 振幅(AE 波形)在四种法向应力($350$, $500$, $800$ 和 $1,000\text{ kPa}$)下显示出相似的 AE 信号结果: 从剪切开始到达到残余状态; AE 信号表现为类似 “纺锤” 的形状,并在峰值强度时产生能量爆发; 进入临界状态(图 2 中的第三阶段)后,AE 信号趋于稳定。
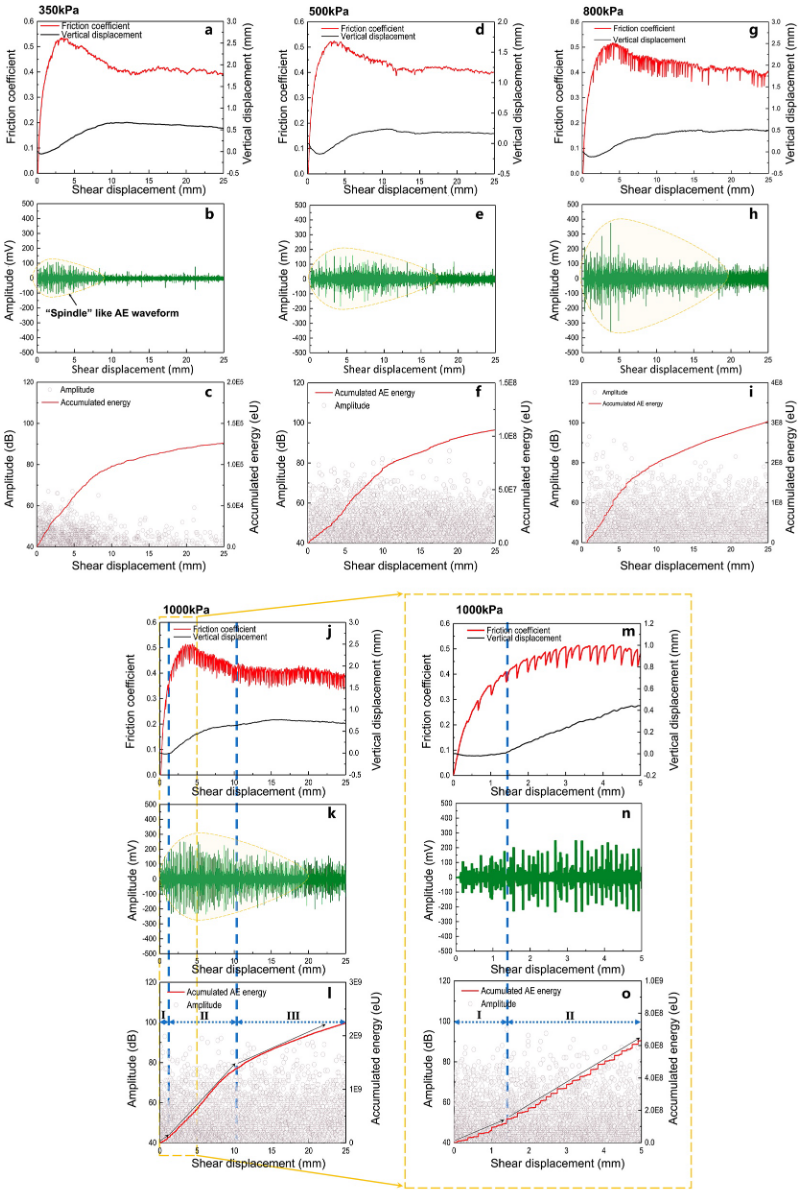
One representative result of the relationships between shear displacement and four parameters (friction coefficient, vertical displacement, acoustic emission (AE) amplitude and accumulated AE energy). (a, d, g, j, m) Friction coefficient and vertical displacement of glass beads ($\varphi = 0.8–1.0\text{ mm}$); (b, e, h, k, n) Amplitude of continuous acquisition AE signal, collected by NI system. (c, f, i, l, o) Amplitude and the accumulated energy of the triggered AE signal, collected by a Micro-II Express-8 Digital AE System.
剪切位移与四个参数(摩擦系数、垂直位移、声发射(AE)振幅和累积 AE 能量)之间关系的代表性结果。(a、d、g、j、m) 玻璃珠的摩擦系数和垂直位移($\varphi = 0.8-1.0\text{ mm}$);(b、e、h、k、n)由 NI 系统采集的连续采集声发射信号的振幅。(c, f, i, l, o) 触发 AE 信号的振幅和累积能量,由 Micro-II Express-8 数字 AE 系统采集。
The relationships between triggered AE amplitude and shear displacement were collected by Micro-II Express-8 Digital AE System (Figures 2c, 2f, 2i, and 2l).
The results of triggered AE signals showed that the number of AE events and the accumulated AE energy increased as the normal stress increased. In addition, taking Figure 2l as an example, the sample vertical displacement, which can express volume change, appeared to correspond well with the accumulated AE energy in three stages.
We can see the details in Figures 2m–2o, which were respectively the first $5\text{ mm}$ shear displacement of Figures 2j–2l enlarged.
Micro-II Express-8 数字 AE 系统采集了触发 AE 振幅与剪切位移之间的关系(图 2c、2f、2i 和 2l)。
触发 AE 信号的结果表明,随着法向应力的增加,AE 事件的数量和累积 AE 能量也在增加。此外,以图 2l 为例,表示体积变化的样品垂直位移似乎与三个阶段的累积 AE 能量十分吻合。
详细情况可参见图 2m-2o,它们分别是图 2j-2l 中前 $5\text{ mm}$ 剪切位移的放大图。
During each experiment, the volume change showed three stages: stage I: shear contraction; stage II: shear dilatation; and stage III: stabilization, which corresponded to the three stages of AE energy release rate from slow to fast and then slow.
We found that accumulated AE energy formed an s-shaped curve: the slope was low at shear contraction stage (stage I); became steeper during shear dilatation stage (stage II); and decreased when the volume was stable (stage III) (Figures 2a, 2c, 2d, 2f, 2g,2i, 2j, and 2l).
At the shear contraction stage, the peak resistance essentially corresponded to the point of maximum AE amplitude (Figures 2a, 2b, 2d, 2e, 2g, 2h, 2j, and 2k).
在每次实验中,体积变化呈现三个阶段: 第一阶段: 剪切收缩;第二阶段: 剪切膨胀;第三阶段: 稳定,这与 AE 能量释放速度从慢到快再到慢的三个阶段相对应。
我们发现,累积的 AE 能量形成了一条 s 形曲线: 在剪切收缩阶段(第一阶段),斜率较低;在剪切膨胀阶段(第二阶段),斜率变陡;在体积稳定阶段(第三阶段),斜率降低(图 2a、2c、2d、2f、2g、2i、2j 和 2l)。
在剪切收缩阶段,阻力峰值基本上与 AE 振幅最大点相对应(图 2a、2b、2d、2e、2g、2h、2j 和 2k)。
We summarized the experimental mechanical properties of three particle sizes of glass beads ($\varphi = 0.8–1.0, 0.4–0.6, 0.1–0.3\text{ mm}$) under four different normal stress conditions with a constant shear speed of $3\text{ mm/min}$. The results exhibited different degrees of stick-slip behavior, shown in Figures 3a–3c.
我们总结了三种颗粒尺寸的玻璃珠($\varphi = 0.8-1.0, 0.4-0.6, 0.1-0.3\text{ mm}$)在四种不同的法向应力条件下的实验力学性能,剪切速度恒定为 $3\text{ mm/min}$。结果显示出不同程度的滞滑行为,如图 3a-3c 所示。
To quantitatively measure the effects of normal stress and particle size on the stick-slip, we analyzed three stick-slip characteristic parameters, including the number of stick-slip events, the stick-slip stress drop (the change in shear resistance before and after the stick-slip failure), and the stick-slip recurrence time (the interval between the occurrence of one stick-slip event and the occurrence of the next stick-slip event). The average value of the stress drops and recurrence time of all stick-slip behaviors throughout the shear process were selected as characteristic quantities for this normal stress condition.
为了定量测量法向应力和颗粒尺寸对滞滑的影响,我们分析了三个滞滑特征参数,包括滞滑事件计数、滞滑应力下降(滞滑破坏前后剪切阻力的变化)和滞滑重现时间(间隔)(发生一次滞滑事件与发生下一次滞滑事件之间的时间间隔)。我们选择了整个剪切过程中所有滞滑行为的应力下降和滞滑重现时间的平均值作为该法向应力条件的特征量。
We found that the number of stick-slip events and amount of stress drop increased both with augmented normal stress and particle size (Figures 3c and 3d). However, the stick-slip recurrence time showed a negative correlation with normal stress and particle size, and the degree of variation was not significant (Figure 3f).
In summary, the stick-slip behavior became more obvious with higher normal stress and larger particle size. These findings were qualitatively similar to those of Jiang et al. (2017), Scuderi et al. (2015), and Veedu et al. (2020).
我们发现,滞滑事件的次数和应力下降量都随着增大的法向应力和颗粒大小而增加(图 3c 和 3d)。然而,滞滑重现时间与法向应力和颗粒大小呈负相关,且变化程度不显著(图 3f)。
总之,当法向应力越大、颗粒尺寸越大时,滞滑行为越明显。这些发现与 Jiang 等人(2017 年)、Scuderi 等人(2015 年)和 Veedu 等人(2020 年)的发现在性质上相似。
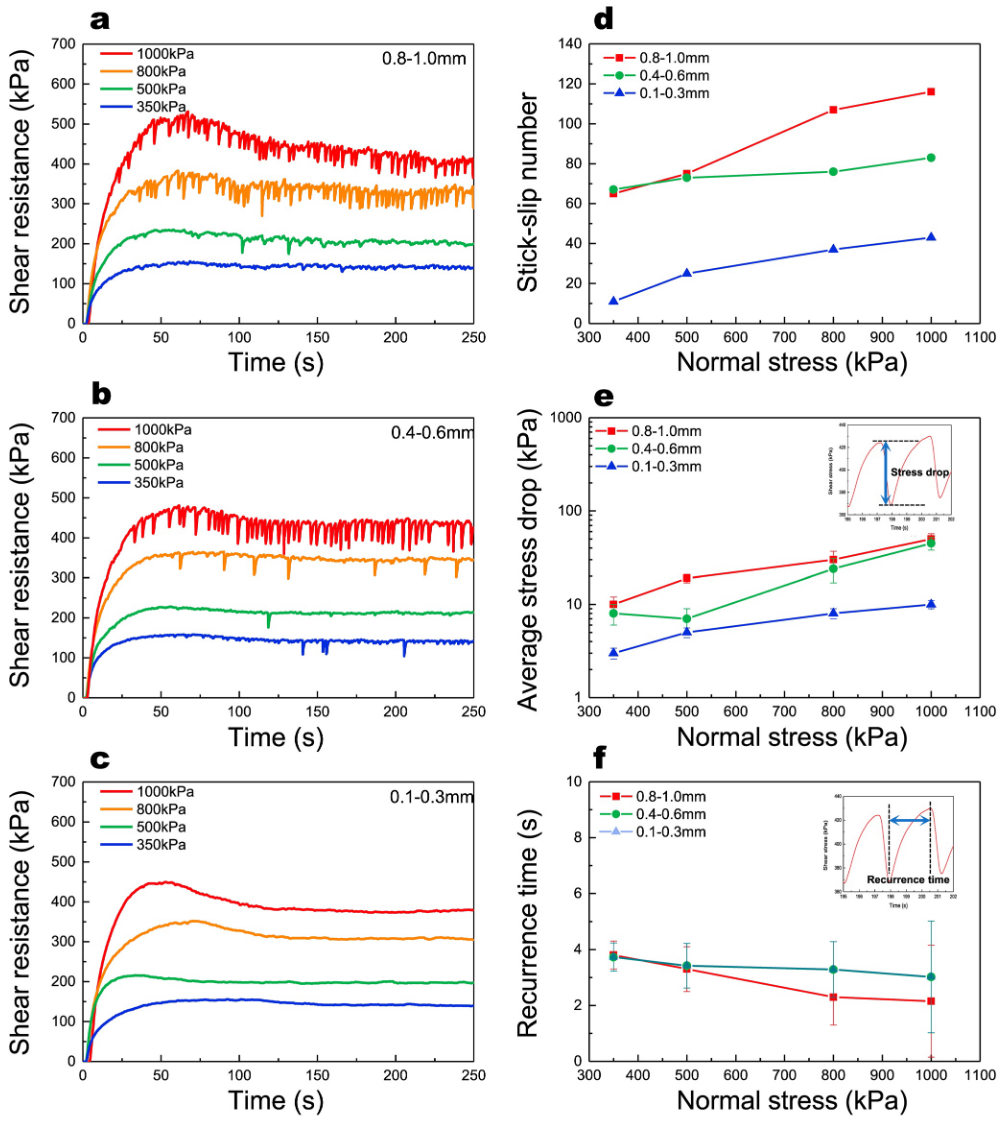
Shear mechanical properties for uniform glass beads packs of three particle sizes under different normal stress conditions: (a) 0.8–1.0 mm, (b) 0.4–0.6 mm, (c) 0.1–0.3 mm, relationship between time and shear resistance during shear process; Relationship between normal stress and (d) Stick slip number, (e) Average stress drop, (f) Recurrence time.
三种颗粒尺度的均匀玻璃珠在不同法向应力条件下的剪切机械性能:(a) $0.8-1.0$ 毫米,(b) $0.4-0.6$ 毫米,(c) $0.1-0.3$ 毫米,剪切过程中时间与剪切阻力之间的关系;法向应力与(d) 滞滑数,(e) 平均应力降,(f) 复现时间之间的关系。
Differences in AE Frequency and Mechanical Variation Between Stick-Slip Failure and Microslip
To analyze the correspondence between the mechanical characteristics of stick-slip behavior and the AE signal, we used the same acquisition system (National Instruments, NI compact DQA) to record the AE signal and the shear resistance signal simultaneously at an acquisition rate of 2 MHz.
Taking the experiment of 1 MPa and 3 mm/min as an example, we selected nine complete single cycle stick-slip events (I∼IX) at different stages during the shearing process for further analysis, as shown in Figure 4a.
The calculation of converting the mechanical signals collected by the NI system to shear resistance is shown in Figure S5 in Supporting Information S1.
为了分析滞滑行为的机械特性与 AE 信号之间的对应关系,我们使用了同一采集系统(美国国家仪器公司,NI compact DQA),以 $2\text{ MHz}$ 的采集速率同时记录 AE 信号和剪切阻力信号。
以 $1$ 兆帕和 $3$ 毫米/分钟的实验为例,我们选取了剪切过程中不同阶段的九个完整的单循环滞滑事件(I∼IX)进行进一步分析,如图 4a 所示。
将 NI 系统收集的机械信号转换为剪切阻力的计算方法见佐证资料 S1 中的图 S5。
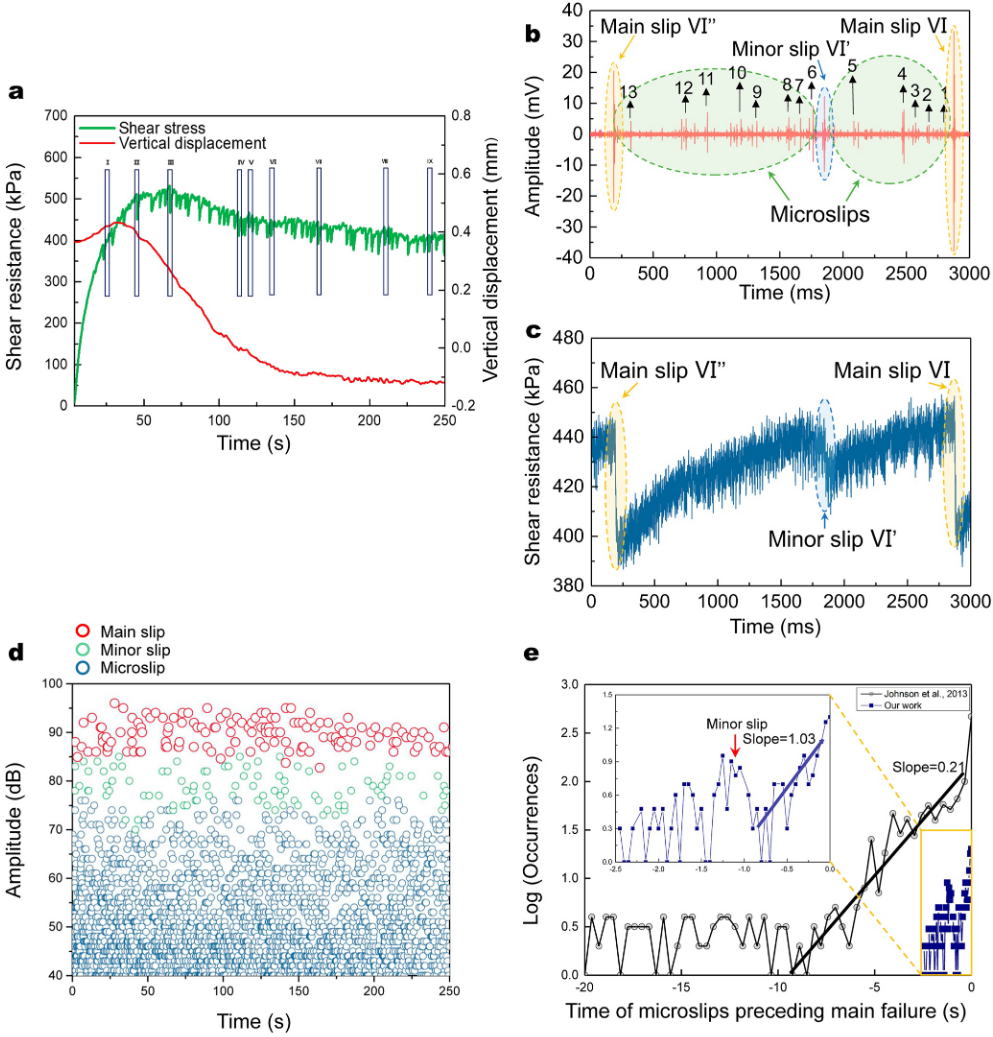
(a) The relationship between shear resistance and vertical displacement with time for 1 mm glass beads packs at 1,000 kPa and 3 mm/min, collected by the ARS apparatus. Nine representative single cycle stick-slip events in different shear stages were selected for further analysis. (b, c) The acoustic emission (AE) amplitude and shear resistance synchronization relationship of the No. VI single cycle stick-slip event in a, collected by NI system a sampling rate of 2 MHz. A complete single cycle stick-slip consists of two main slips (orange), one minor slip (blue), and numerous microslips (green). (d) AE amplitude difference of main slip, minor slip and microslips, collected by the Micro-II Express-8 Digital AE System. (e) Occurrence versus time plot (log-log scale) for microslip before main slip in single cycle stick-slip.
(a) ARS 仪器收集的 $1$ 毫米玻璃珠在 $1 000$ 千帕和 $3$ 毫米/分钟的剪切阻力和垂直位移随时间的变化关系。选取了不同剪切阶段的九个有代表性的单周期滞滑事件作进一步分析。 (b, c) NI 系统以 $2\text{ MHz}$ 的采样率采集的 (a) 中 VI 号单周期滞滑事件的声发射(AE)振幅和剪切阻力同步关系。一个完整的单周期滞滑由两个主滑(橙色)、一个小滑(蓝色)和许多微滑(绿色)组成。 (d) Micro-II Express-8 数字 AE 系统采集的主滑移、次滑移和微滑移的 AE 振幅差。 (e) 单周期滞滑中, 主滑移前微滑移的发生率与时间关系图(对数-对数刻度)。
Taking the No. VI stick-slip event as an example, we show the correspondence between the shear resistance and the AE amplitude (Figures 4b and 4c). Three characteristic phenomena of the single cycle stick-slip event are defined in this paper:
Main slip: Stick-slip failure, the behavior of quasi-periodic stress drop during stick-slip (Berman et al., 1996), such as the VI and VI′′ mechanical behavior in Figure 4c. A single cycle stick-slip consisted of two main slips (from the end of one stick-slip failure to the occurrence of the next stick-slip failure). This process generated AE signals of different magnitude, as shown in Figure 4b.
Minor slip: Minor failure between two main slips, such as the VI′ mechanical behavior in Figure 4c. Few studies have proposed the definition of minor slip, but in the experimental result of this paper, we found that minor slip commonly existed between two main slips, and the stress drop was smaller than that of the main slips (Figure 4c, Figures S7–S11 in Supporting Information S1). Therefore, we classified minor slip as a characteristic event in a single cycle of stick-slip separately.
Microslip: The mechanical behavior corresponded with small amplitude AEs before stick-slip failure occurred. At the time scale of Figure 4c, we were not yet able to see the mechanical changes of microslip clearly. But we can see many small amplitude AEs in Figure 4b, which are called precursory AEs in Johnson et al. (2013) and demonstrate a strong correlation with microslips. We chose No. 1∼13 AEs in different periods of single cycle stick-slip to study microslip in depth.
以 VI 号滞滑事件为例,我们展示了剪切阻力与 AE 振幅之间的对应关系(图 4b 和 4c)。本文定义了单周期滞滑事件的三种特征现象:
-
主滑移: 滞滑破坏,即滞滑过程中的 准周期应力下降 行为(Berman 等人,1996 年),如图 4c 中的 VI 和 VI$^{\prime\prime}$ 机械行为。单周期滞滑包括两次主滑移(从一次滞滑破坏结束到下一次滞滑破坏发生)。如图 4b 所示,这一过程产生了不同幅度的 AE 信号。
-
小滑移: 两个主滑移之间的轻度破坏,如图 4c 中的 VI$^{\prime}$ 力学行为。很少有研究提出小滑移的定义,但在本文的实验结果中,我们发现小滑移普遍存在于两个主滑移之间,且应力下降比主滑移小(图 4c,佐证资料 S1 中的图 S7-S11)。因此,我们将小滑移单独列为单周期滞滑的特征事件。
-
微滑移: 在发生滞滑破坏之前,机械行为与小振幅 AE 相一致。在图 4c 的时间尺度上,我们还无法清楚地看到微滑动的力学变化。但我们可以在图 4b 中看到许多小振幅 AEs,Johnson 等人(2013 年)将其称为前兆声发射,并证明它们与微滑移密切相关。我们选择了单周期滞滑的不同时期的 1∼13 号 AEs 来深入研究微滑动。
By observing the mechanical performance and AE amplitude characteristics of single cycle stick-slip, we found that the main slip generated a high AE amplitude of $20–40\text{ mV}$ (AE amplitude corresponding main slip VI and VI$^{\prime\prime}$ in Figure 4b). Numerous low-amplitude AEs associated with microslips of $2\sim 4\text{ mV}$ (No. 1–13 AEs in Figure 4b) were generated during stress accumulation between the two main slips. The AE amplitude of the minor slip (AE amplitude corresponding to the minor slip VI$^{\prime}$ in Figure 4b) was smaller than the AE amplitude of the main slip, but it was still larger than that of microslips, which were about $10–15\text{ mV}$.
通过观察单周期滞滑的力学性能和 AE 振幅特征,我们发现主滑移产生了高的 AE 振幅 $20-40\text{mV}$(图 4b 中与主滑移 VI 和 VI$^{\prime\prime}$ 相对应的 AE 振幅)。在两个主滑移之间的应力累积过程中,产生了许多与 $2\sim 4\text{ mV}$ 的与微滑移关联的低振幅 AE(图 4b 中 1-13 号 AE)。小滑移的 AE 振幅(图 4b 中与小滑移 VI$^{\prime}$ 相对应的 AE 振幅)小于主滑移的 AE 振幅,但仍大于微滑移的 AE 振幅,微滑移的 AE 振幅约为 $10-15\text{mV}$。
The AE amplitudes of main slip, minor slip, and microslips collected by the Micro-II Express-8 Digital AE System during the whole shear process can also be easily distinguished, as shown in Figure 4d. In addition, we also analyzed the occurrence versus time plot (log-log scale) for microslip before the main slip as in Johnson et al. (2013) and the data trends were approximately the same as shown in Figure 4e. In a difference with Johnson et al., the occurrence of microslip had another fluctuation due to the presence of minor slip. The slope of microslip occurrence versus time before the main slip in this study was $1.03$, differing from the $0.21$ of Johnson et al., which may be caused by different apparatus or different experimental conditions.
如图 4d 所示,在整个剪切过程中,Micro-II Express-8 数字 AE 系统采集到的主滑移、次滑移和微滑移的 AE 振幅也很容易区分。此外,我们还按照 Johnson 等人(2013 年)的方法分析了主滑移前微滑移的发生率与时间关系图(对数-对数标度),数据趋势大致相同,如图 4e 所示。与 Johnson 等(2013 年)不同的是,由于小滑动的存在,微滑动的发生率出现了另一种波动。本研究中微滑发生率与主滑移前时间的斜率为 $1.03$,与 Johnson 等人的 $0.21$不同,这可能是仪器不同或实验条件不同造成的。
To analyze the correspondence between the AE frequency and mechanical characteristics at different stages during a single cycle stick-slip, we extracted AEs corresponding to main slip VI and VI$^{\prime\prime}$, AEs corresponding to minor slip VI$^{\prime}$, and No. 1–13 AEs associated with microslips from Figure 4b, combined with instantaneous frequencies determination (Hilbert-Huang transform).
为了分析单周期滞滑过程中不同阶段的 AE 频率与力学特征之间的对应关系,我们从图 4b 中提取了与主滑移 VI 和 VI$^{\prime\prime}$ 相对应的 AE、与次滑移 VI$^{\prime}$ 相对应的 AE 以及与微滑移相关的 1-13 号 AE,并结合瞬时频率测定(Hilbert-Huang 变换)进行了分析。
我自己现在是用的matlab的 spectrogram() 算法, 现在重读一遍发现他们似乎是使用的什么其他的算法?这个需要后续去研究一下
By an empirical mode decomposition technique, the signal was decomposed into a set of vibrational components; the intrinsic mode function, and the main signals were superimposed after removing ambient noise (Huang et al., 1998). See Figure S6 in Supporting Information S1 for details. Then a short-term Fourier transform was performed to interpret the AE frequency of the single cycle stick-slip formation process in the time domain.
通过经验模式分解技术,信号被分解成一组振动成分;本征模式函数和主信号在去除环境噪声后被叠加(Huang 等人,1998 年)。详见佐证资料 S1 中的图 S6。然后进行短期傅里叶变换,在时域上解释单周期滞滑形成过程的 AE 频率。
原来这里的新算法主要是去除环境噪音的影响?
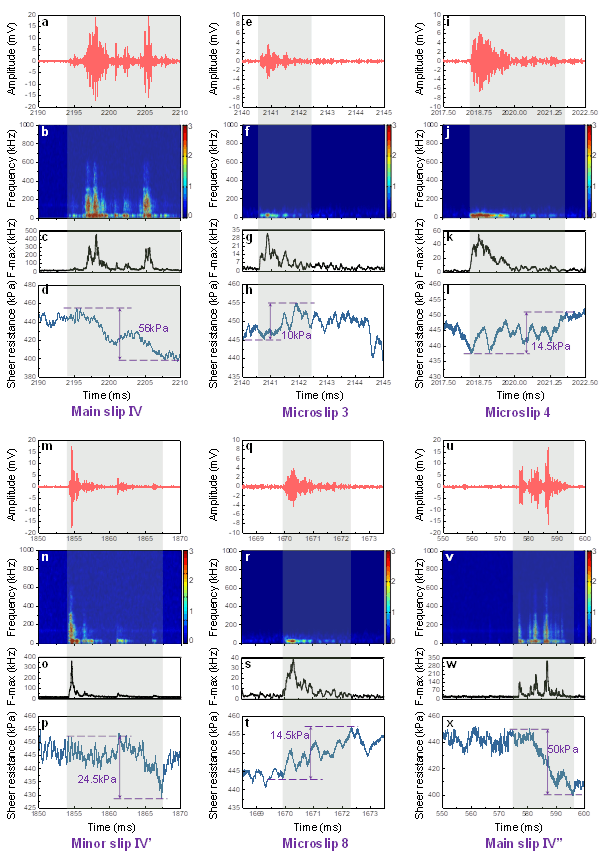
We have enlarged the horizontal coordinates of Figures 4b and 4c and analyzed the AEs and mechanical characteristics on a time scale of less than 20 ms. From the waveforms of AEs at different stages (amplitude vs. time, Figures 5a, 5e, 5i, 5m, 5q, and 5u), we saw that the AEs corresponding to main slips (Figures 5a and 5u) were of high amplitude and relatively long duration (about $10\text{ ms}$). The AEs associated with microslips (Figures 5e, 5i, and 5q) were of low amplitude and short duration (about $2\text{ ms}$).
我们放大了图 4b 和图 4c 的横坐标,分析了时间尺度小于 $20$ 毫秒的 AE 和机械特性。从不同阶段的 AE 波形(振幅与时间的关系,图 5a、5e、5i、5m、5q 和 5u)可以看出,与主滑移相对应的 AE(图 5a 和 5u)振幅较高,持续时间相对较长(约 $10\text{ms}$)。与微滑动相关的 AE(图 5e、5i 和 5q)振幅较低,持续时间较短(约 $2\text{ ms}$)。
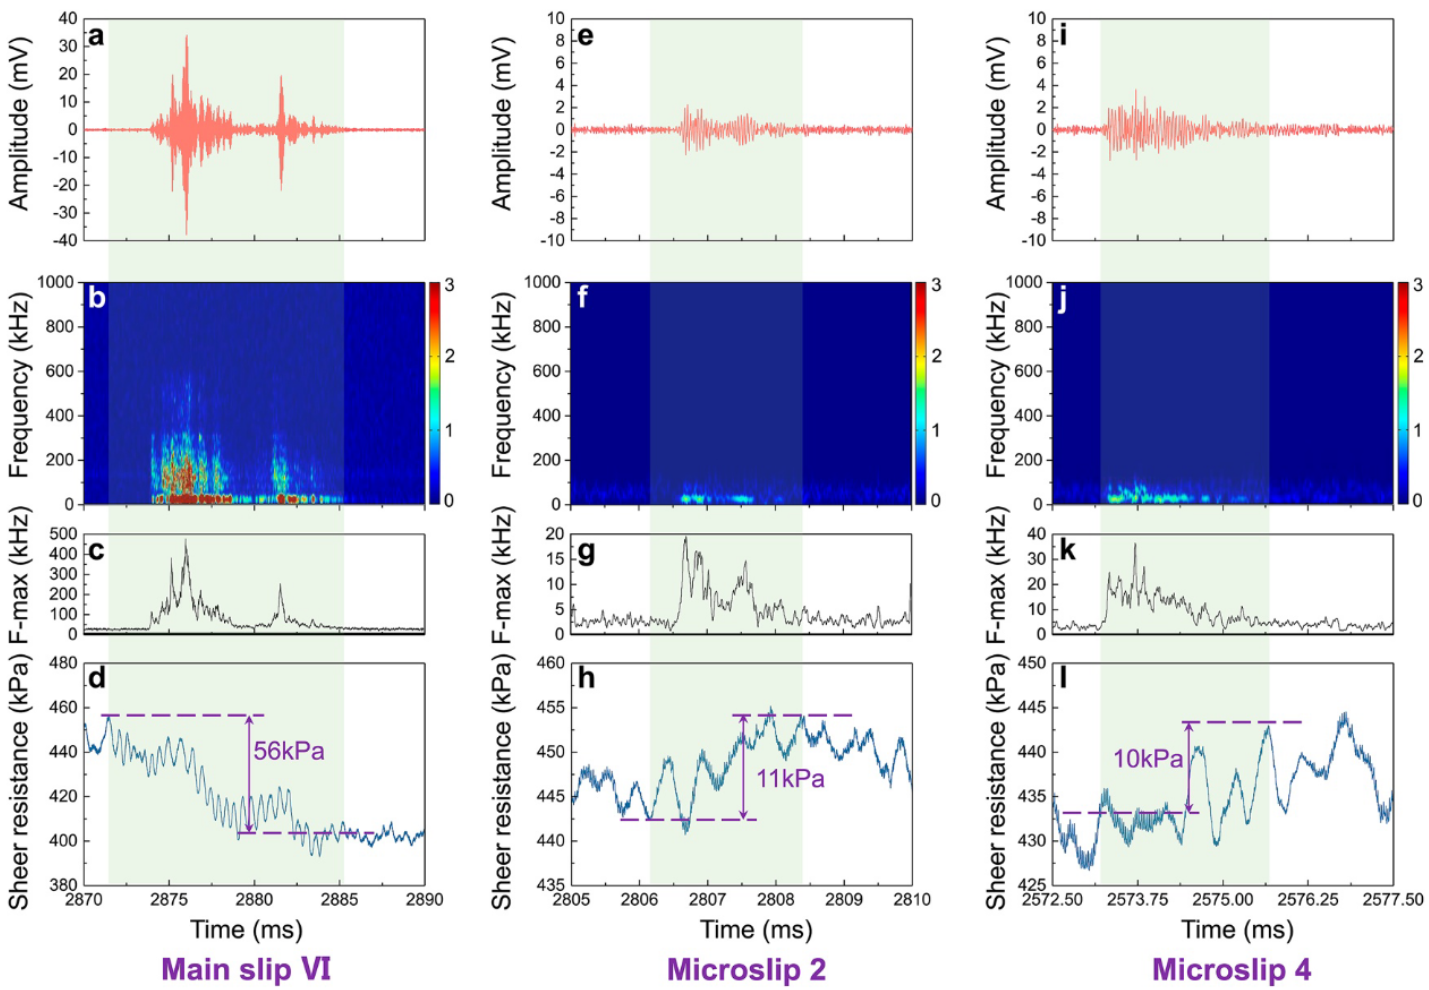
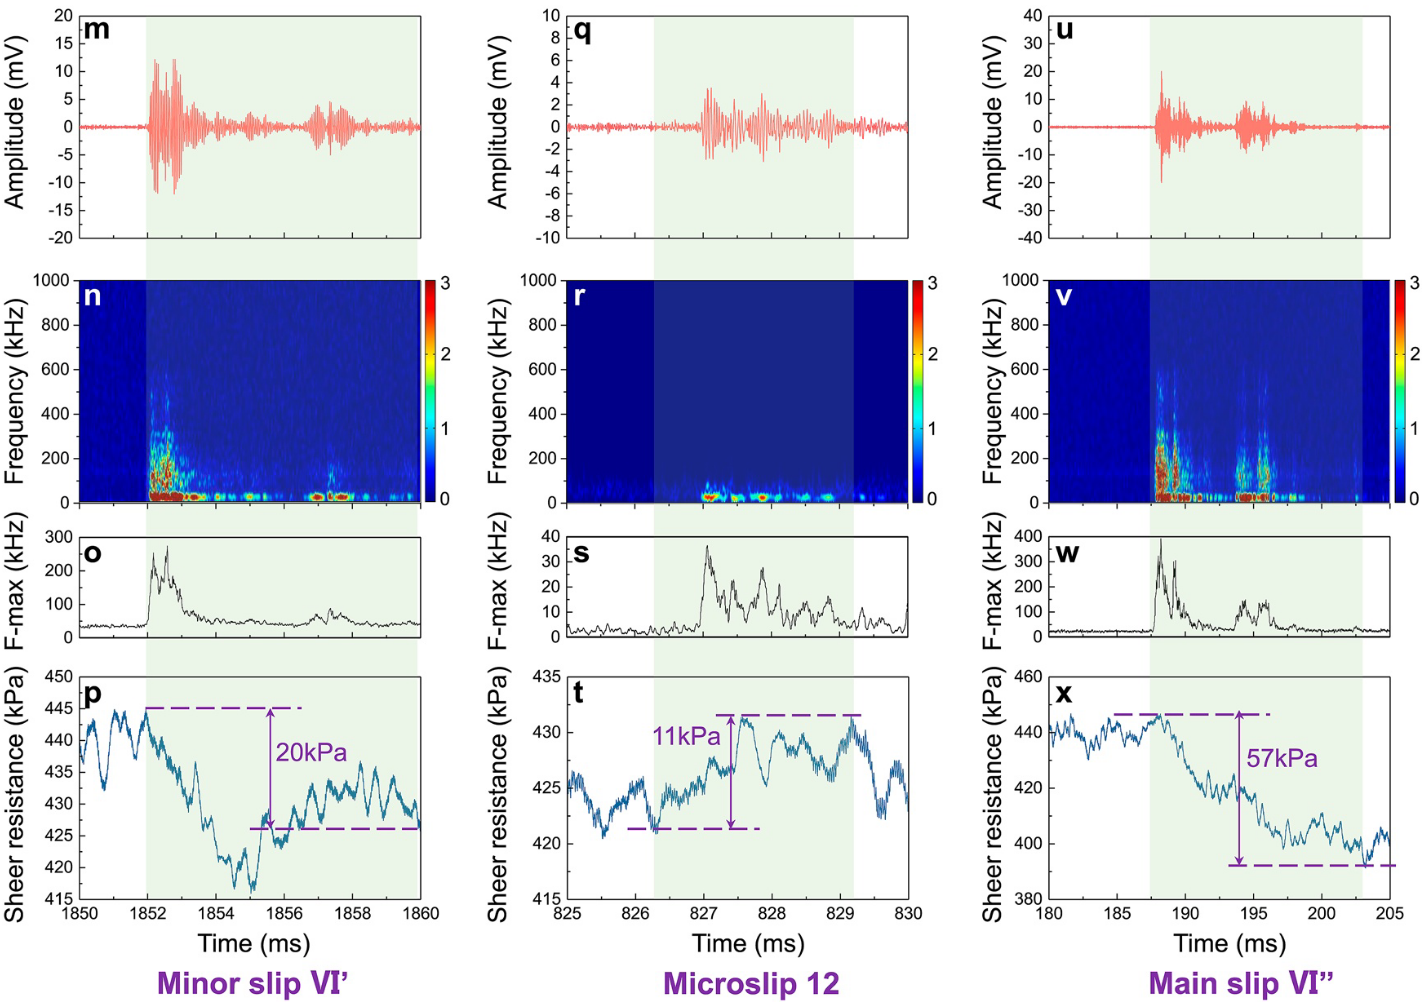
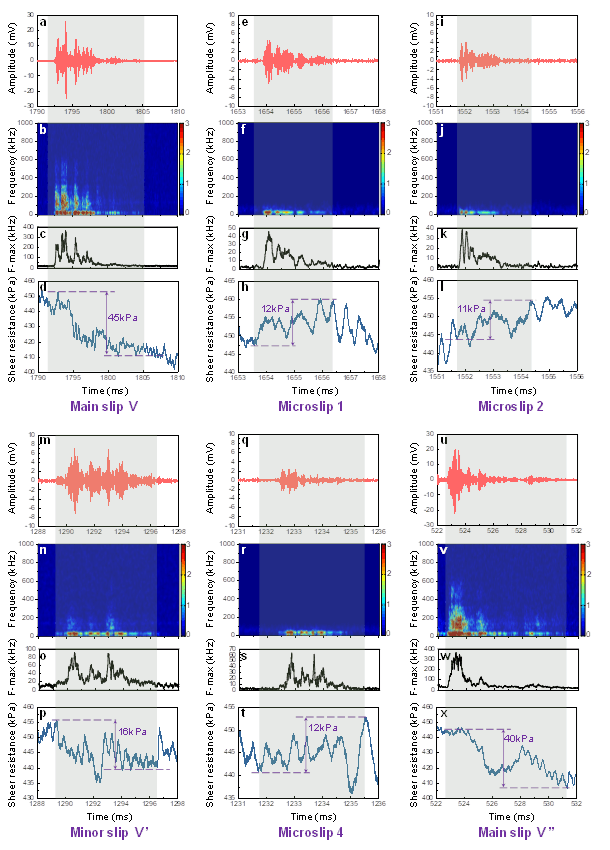
Synchronous comparisons between acoustic emission (AE) and mechanical signals of the main slips, minor slip, and microslips within No. VI single cycle stick-slip. The results of two main slips, one minor slip, and three selected representative microslips in No. VI stick-slip are shown. The No. 2, 4, and 12 microslips occurred representatively at different periods of the single cycle stick-slip. (a, e, i, m, q, u) AE waveforms of main slips, minor slip, and microslips (AE amplitude vs. time). (b, f, j, n, r, v) AE frequency as a function of time. (c, g, k, o, s, w) Frequency marginal spectrum of AEs. (d, h, l, p, t, x) Shear resistance as a function of time.
No. VI 单周期粘性滑移中主滑移、次滑移和微滑移的声发射(AE)和机械信号的同步比较。图中显示了 VI 号滞滑中两个主滑移、一个次滑移和三个选定的代表性微滑移的结果。2 号、4 号和 12 号微滑移分别发生在单周期粘滞滑移的不同时期,具有代表性。(a、e、i、m、q、u) 主滑移、小滑移和微滑移的 AE 波形(AE 振幅与时间的关系)。(b, f, j, n, r, v) AE 频率与时间的关系。(c、g、k、o、s、w) AE 的边际频谱。(d、h、l、p、t、x) 剪切阻力与时间的函数关系。
The amplitude and duration of the AEs corresponding to minor slip (Figure 5m) was intermediate between those of the main slips and micro-slips (with a duration of about $6\text{ ms}$). Using the above short-term Fourier transform, the time-frequency characteristics of the AEs at different stages were obtained (Figures 5b, 5c, 5f, 5g, 5j, 5k, 5n, 5o, 5r, 5s, 5v, and 5w).
与小滑移(图 5m)相对应的 AE 的振幅和持续时间介于主滑移和微滑移之间(持续时间约为 $6\text{ms}$)。利用上述短时傅立叶变换,得到了不同阶段 AE 的时频特征(图 5b、5c、5f、5g、5j、5k、5n、5o、5r、5s、5v 和 5w)。
We found that the AEs corresponding to main slips (Figures 5b, 5c, 5v, and 5w) had a high frequency and high energy, with the maximum frequency up to $500\text{ kHz}$. The AEs associated with microslips (Figures 5f, 5g, 5j, 5k, 5r, and 5s) had lower frequency and lower energy, with a maximum frequency of only about $40\text{ kHz}$. And the AEs corresponding to minor slip (Figures 5n and 5o) had similar frequency and energy characteristics to those of AEs corresponding to the main slips, but the AE frequency and energy corresponding to the minor slip was lower (with a maximum frequency of about $280\text{ kHz}$).
我们发现,与主滑动相对应的AEs(图5b、5c、5v和5w)具有高频率和高能量,最大频率可达 $500\text{ kHz}$。与微滑移相关的 AE(图 5f、5g、5j、5k、5r 和 5s)频率较低,能量也较低,最大频率仅约为 $40\text{kHz}$。而小滑移对应的 AE(图 5n 和 5o)与主滑移对应的 AE 频率和能量特征相似,但小滑移对应的 AE 频率和能量较低(最大频率约为 $280\text{ kHz}$)。
In addition, the mechanical characteristics of the main slip, minor slip, and microslips were very different, as shown in Figures 5d, 5h, 5l, 5p, 5t, and 5x. The main slip exhibited a large stress drop (Jiang et al., 2017; Johnson et al., 2013; Scuderi et al., 2016) (as shown in Figures 5d and 5x, about $50–60\text{ kPa}$ in this study) accompanied by high frequency AEs.
此外,如图 5d、5h、5l、5p、5t 和 5x 所示,主滑移、次滑移和微滑移的机械特性也大不相同。主滑移表现出较大的应力下降(Jiang 等人,2017 年;Johnson 等人,2013 年;Scuderi 等人,2016 年)(如图 5d 和 5x 所示,在本研究中约为 50-60 kPa),并伴有高频 AE。
The stress drop generated by minor slip was smaller (Figure 5p, about $30\text{ kPa}$) and some high frequency AEs were also present. However, the mechanical characteristics of microslips differed from the stress drop exhibited by the main slip and minor slip, but were accompanied by a slight increase in shear resistance, as shown in Figures 5h, 5l, and 5t. Each generation of low-frequency AEs corresponded to a shear resistance increase of $10–15\text{ kPa}$.
小滑移产生的应力降较小(图 5p,约 $30\text{kPa}$),也存在一些高频 AE。然而,如图 5h、5l 和 5t 所示,微滑移的机械特性不同于主滑移和次滑移所表现出的应力降,而是伴随着剪切阻力的轻微增加。每一次产生低频 AE 都对应着 $10-15\text{ kPa}$ 的剪切阻力增加。
The shear resistance increases corresponding to microslips and the stress drop corresponding to the main slip and minor slip may originate from different physical mechanisms. The same pattern was observed in experiments with other particle sizes and normal stress conditions (Figures S7–S11 in Supporting Information S1). In addition, we also showed the background signal without any obvious AEs corresponding to the same scale as Figure 5, as shown in Figure S12 in Supporting Information S1. The background signal showed a cleaner spectrum and smoother mechanical change.
与微滑移相对应的剪切阻力增加以及与主滑移和次滑移相对应的应力下降可能源于不同的物理机制。在其他粒度和正常应力条件下的实验中也观察到了相同的模式(图 S7-S11,见佐证资料 S1)。此外,我们还显示了与图 5 相同比例的无明显 AE 的背景信号,如佐证资料 S1 中的图 S12 所示。背景信号显示出更清晰的频谱和更平滑的机械变化。
Discussion
Through the ring-shear friction experiment, we analyzed the effect of different normal stresses and different particle sizes on the stick-slip behavior of granular materials, which was qualitatively consistent with previous studies (Jiang et al., 2017; Scuderi et al., 2015; Veedu et al., 2020). Our study focused on the results of ring-shear friction experiments with high-frequency (sampling rate: 2 MHz) simultaneous acquisition of AE and mechanical signals. During the shear process, we monitored changes in the amplitude and energy of AE (acoustic emission) signals. We noted that energy bursts occurred at the peak shear resistance. Additionally, we observed a noteworthy difference in the AE frequencies between microslips and stick-slip failures in a single cycle stick-slip event. We also found that microslips exhibited an increase in shear resistance during the stick-slip nucleation process.
通过环剪摩擦实验,我们分析了不同法向应力和不同颗粒尺寸对颗粒材料滞滑行为的影响,这与之前的研究(Jiang 等,2017;Scuderi 等,2015;Veedu 等,2020)在性质上是一致的。我们的研究侧重于高频(采样率:$2\text{ MHz}$)同时采集 AE 和机械信号的环形剪切摩擦实验结果。在剪切过程中,我们监测了声发射信号的振幅和能量变化。我们注意到,能量爆发发生在剪切阻力峰值处。此外,我们还观察到,在单周期滞滑事件中,微滑和滞滑故障的声发射频率存在显著差异。我们还发现,微滑动在滞滑成核过程中表现出剪切阻力的增加。
Causes of “Spindle”-Like AE Waveform Formation
First, the relationship between the AE amplitude and the corresponding mechanical characteristics throughout the shear process was analyzed. The s-shaped curve (Figures 2c, 2f, 2i, and 2l) variation pattern also corresponded to the variation pattern of the sample volume, which may explain the variation of the AE amplitude in terms of the increment of external work per unit volume delivered to the particle skeleton. The unit-volume boundary work had two components: the unit-volume distortion work, which led to a change in sample shape; and the volume work per unit volume, which led to a change in sample volume (Hanley et al., 2018).
首先,分析了整个剪切过程中 AE 振幅与相应机械特性之间的关系。s 形曲线(图 2c、2f、2i 和 2l)的变化规律也与样品体积的变化规律相对应,这可以从传递给颗粒框架的单位体积外功的增量来解释 AE 振幅的变化。单位体积边界功由两部分组成:单位体积变形功,导致样品形状发生变化;单位体积体积功,导致样品体积发生变化(Hanley 等人,2018 年)。
Therefore, Equation $\eqref{eq1}$ could be used to quantify the work done in the ring-shear experiments to compare with the measured AEs:
$$ \mathrm{d}W = \sigma\mathrm{d}v + \tau\mathrm{d}r\tag{1}\label{eq1} $$
where $\mathrm{d}W$ is the work done per unit volume, $\mathrm{d}r$ and $\mathrm{d}v$ are the increments of shear strain and volume strain, respectively, and $\sigma$ and $\tau$ are the normal stress and shear resistance, respectively. Hanley et al. (2018) multiplied the current sample volume by the work done per unit volume for each increment and suggested that the generation of high amplitude, high energy AEs during shear dilatation may be due to the larger work done per unit volume compared to the shear dilatation, and finally stabilization. Thus, the image of the AE amplitude versus shear displacement during shear dilatation resembled a “spindle”-like shape (Figures 2b, 2e, 2h, and 2k).
因此,等式 $\eqref{eq1}$ 可用来量化环剪实验中做的功,以便与测得的 AEs 进行比较:
$$ \mathrm{d}W = \sigma\mathrm{d}v + \tau\mathrm{d}r $$
其中,$\mathrm{d}W$ 为单位体积做功, $\mathrm{d}r$ 和 $\mathrm{d}v$ 分别为剪切应变增量和体积应变增量,$\sigma$ 和 $\tau$ 分别为法向应力和剪切阻力。Hanley 等人(2018)将当前样品体积乘以每个增量的单位体积做功,认为剪切膨胀过程中产生高振幅、高能量 AE 可能是由于单位体积做功比剪切膨胀大,最终趋于稳定。因此,在剪切扩张过程中,AE 振幅与剪切位移的图像类似于 “纺锤” 状(图 2b、2e、2h 和 2k)。
Different Mechanisms Between Microslips and Stick-Slip Failures
To explain each single cycle stick-slip process, we use the force-chain concept. Force chains form the stress-bearing skeleton of granular materials, and the associated force bearing particles account for the major shear resistance of the system (Staron & Radjai, 2005). Force chains can be observed through photoelastic granular experiments (Owens & Daniels, 2011, 2013). Numerous authors argue that faulted granular materials in the laboratory which produce unstable sliding are deformed by continuous development and breakage of force chains (Anthony & Marone, 2005; Biegel et al., 1989; Tordesillas, 2007).
为了解释每个单循环滞滑过程,我们使用了力链概念。力链构成了颗粒材料的应力承载骨架,相关的力承载颗粒构成了系统的主要剪切阻力(Staron 和 Radjai,2005 年)。力链可通过光弹性颗粒实验观察到(Owens 和 Daniels,2011 年,2013 年)。许多学者认为,实验室中产生不稳定滑动的断层颗粒材料是通过力链的不断发展和断裂而变形的(Anthony 和 Marone,2005 年;Biegel 等人,1989 年;Tordesillas,2007 年)。
The results of the fluctuations of shear resistance in this study suggest that the interacting forces and force chains between the grains change quasi-periodically (Figure 4a). Stick-slip failure is accompanied by characteristic AEs, such as high amplitude, high frequency, etc.(Brzinski & Daniels, 2018; Jiang et al., 2017; Johnson et al., 2013; Ostapchuk & Morozova, 2020). We use the conceptual model of force chains to explain the correspondence between AE and mechanical characteristics of the main slips, minor slip, and microslips in a single cycle stick-slip event.
本研究中剪切阻力的涨落结果表明,颗粒间的相互作用力和力链呈准周期性变化(图 4a)。滞滑破坏伴随着高振幅、高频率等特征性 AE(Brzinski & Daniels,2018;Jiang 等人,2017;Johnson 等人,2013;Ostapchuk & Morozova,2020)。我们使用力链概念模型来解释单周期滞滑事件中 AE 与主滑动、次滑动和微滑动的力学特征之间的对应关系。
We found that both stick-slip main slip and minor slip emitted higher frequency ($>100\text{ kHz}$) AEs, while microslips emitted lower frequency ($\sim 25 \text{ kHz}$) AEs (Figures 5b, 5f, 5j, 5n, 5r, and 5v). Brzinski and Daniels (2018) also reports AE frequency differences before and after stick-slip failure. However, Brzinski and Daniels (2018) lacks any analysis of the mechanical characteristics corresponding to specific AEs.
我们发现,滞滑主滑移和小滑移都发出了较高频率($>100 \text{ kHz}$)的AE,而微滑移则发出了较低频率($\sim 25 \text{ kHz}$)的AE(图5b、5f、5j、5n、5r和5v)。Brzinski 和 Daniels(2018 年)也报告了滞滑破坏前后的 AE 频率差异。然而,Brzinski 和 Daniels(2018 年)缺乏对特定 AE 对应的机械特性的分析。
在分析频域特征前, 至少也应该按照同步的机械信号的种类进行归类
One of the core discoveries of our study is that the mechanical behavior of microslips corresponding to low-frequency AEs exhibit shear resistance strengthening (Figures 5d, 5h, 5l, 5p, 5t, and 5x), differing from the stress drop of the main slip or minor slip. We did the statistics of the stress drop of main slips, minor slips, and microslips of all single cycle stick-slip in Figure 4a, as shown in Figure 6.
我们研究的核心发现之一是,低频 AE 对应的微滑移的力学行为表现出抗剪加强(图 5d、5h、5l、5p、5t 和 5x),与主滑移或次滑移的应力降不同。我们对图 4a 中所有单周期滞滑的主滑移、次滑移和微滑移的应力降进行了统计,如图 6 所示。
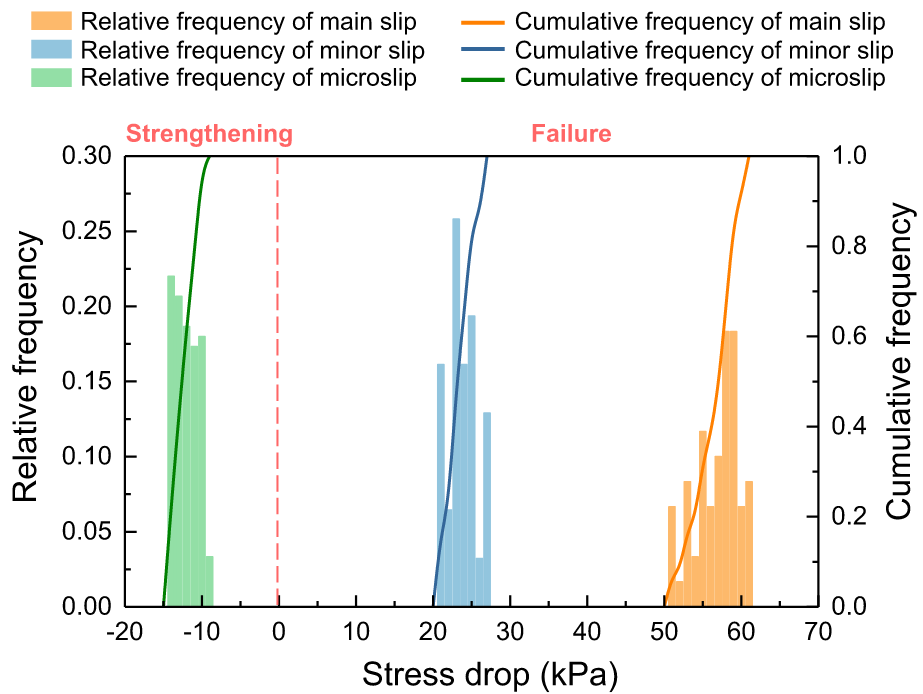
Statistical results for the frequency of events with different stress drops for all main slips, minor slips and microslips respectively under experimental conditions of $1\text{ mm}$ glass beads packs under $1,000\text{ kPa}$, $3 \text{ mm/ min}$, including relative frequency and cumulative frequency.
在 $1,000 \text{ kPa}$、$3 \text{ mm/ min}$ 的实验条件下,$1 \text{ mm}$ 玻璃珠堆积的所有主滑移、次滑移和微滑移的不同应力下降事件频率的统计结果,包括 相对频率 和 累积频率。
Our experimental results provide evidence for Marty et al. (2021)’s idea that precursory AEs during the nucleation stage is an almost fully aseismic process. We suggest that the nucleation processes (expressed as shear resistance strengthening) and failure processes (expressed as stress drop) of stick-slip may originate from different physical mechanisms.
我们的实验结果为 Marty 等人(2021 年)的观点提供了证据,即成核阶段的前兆 AE 几乎是一个完全的非地震过程。我们认为,滞滑的成核过程(表现为剪切阻力增强)和破坏过程(表现为应力降)可能源自不同的物理机制。
Previous studies use the force-chain conceptual model and interpret stick-slip failure as a continuous accumulation of elastic energy followed by a sudden release (Owens & Daniels, 2011, 2013): the density of vibrational modes of the granular material keeps increasing to a certain critical state, then the force chain breaks and the particles crash violently. Thus, we suggest that when stick-slip failure occurs, the stored elastic energy is partially released as AEs due to particle collision. These AEs exhibited large energy and high amplitude, and the AE frequency is also extremely high, up to several hundred kHz, as shown in Figure 7c. Mao et al. (2018) reports AE frequency greater than $100\text{ kHz}$ generated by particle crushing.
以往的研究采用力链概念模型,将滞滑破坏解释为弹性能量的持续积累和突然释放(Owens 和 Daniels,2011 年,2013 年):颗粒材料的振动模式密度持续增加到某个临界状态,然后力链断裂,颗粒发生剧烈碰撞。因此,我们认为当发生滞滑破坏时,存储的弹性能量会因颗粒碰撞而以 AE 的形式部分释放出来。如图 7c 所示,这些 AE 表现出大能量和高振幅,AE 频率也极高,高达几百 $\text{kHz}$。Mao 等人(2018 年)报告了颗粒破碎产生的 AE 频率大于 $100\text{ kHz}$。
However, we did sieve experiments on the glass beads packs after the shear experiment and found that there was no particle crushing in our study. So, we presume that particle collision with large energy may also generate high-frequency ($>100\text{ kHz}$) AEs, which need a high sampling frequency to be used to detect them (e.g., $2\text{ MHz}$ in this study). Besides, our study observed minor slip between the two main slips.
不过,我们在剪切实验后对玻璃珠堆积进行了筛分实验,发现在我们的研究中没有出现颗粒破碎现象。因此,我们推测能量较大的粒子碰撞也可能产生高频($>100\text{ kHz}$)AE,这需要使用较高的采样频率来检测(例如本研究中的 $2\text{ MHz}$)。此外,我们的研究还观测到了两个主要滑移之间的小滑移。
Minor slip had similar mechanical and AE characteristics to those of main slips, whose generation mechanism may be like the main slips. Minor slip may belong to the local structural instability that occurs during force-chain evolution during the elastic energy accumulation, resulting in small magnitude stress drops (Staron et al., 2002).
小滑移具有与主滑移相似的力学和 AE 特性,其产生机制可能与主滑移相同。小滑移可能属于弹性能量积累过程中力链演化过程中出现的局部结构不稳定性,导致小幅应力下降(Staron 等人,2002 年)。
Specifically, we thought that the mechanism of microslips during the nucleation stage was different from that of stick-slip failure. After the formation of force chains, intergranular friction caused the grains to roll until a critical shear resistance and a favorable sliding direction at the grain junction are reached. Some studies report scratches left from interactions between particles (Scuderi et al., 2014, 2015).
具体而言,我们认为成核阶段的微滑动机制不同于滞滑破坏。力链形成后,颗粒间的摩擦会导致颗粒滚动,直到达到临界剪切阻力和颗粒交界处的有利滑动方向。一些研究报告了颗粒间相互作用留下的划痕(Scuderi 等人,2014 年,2015 年)。
Thus, we suggest that the physical mechanism of microslips during the nucleation stage may be due to continuous interaction between particles during the evolution of force chains (friction, rolling). This process would generate AEs at a lower frequency (at about several $10\text{ kHz}$, shown as Figure 7b) than AEs generated by the breakage of force chains when critical shear resistance is reached.
因此,我们认为成核阶段微滑动的物理机制可能是由于力链(摩擦、滚动)演变过程中颗粒之间的持续相互作用。与达到临界剪切阻力时力链断裂产生的 AE 相比,这一过程产生的 AE 频率较低(约为 $10\text{ kHz}$,如图 7b 所示)。
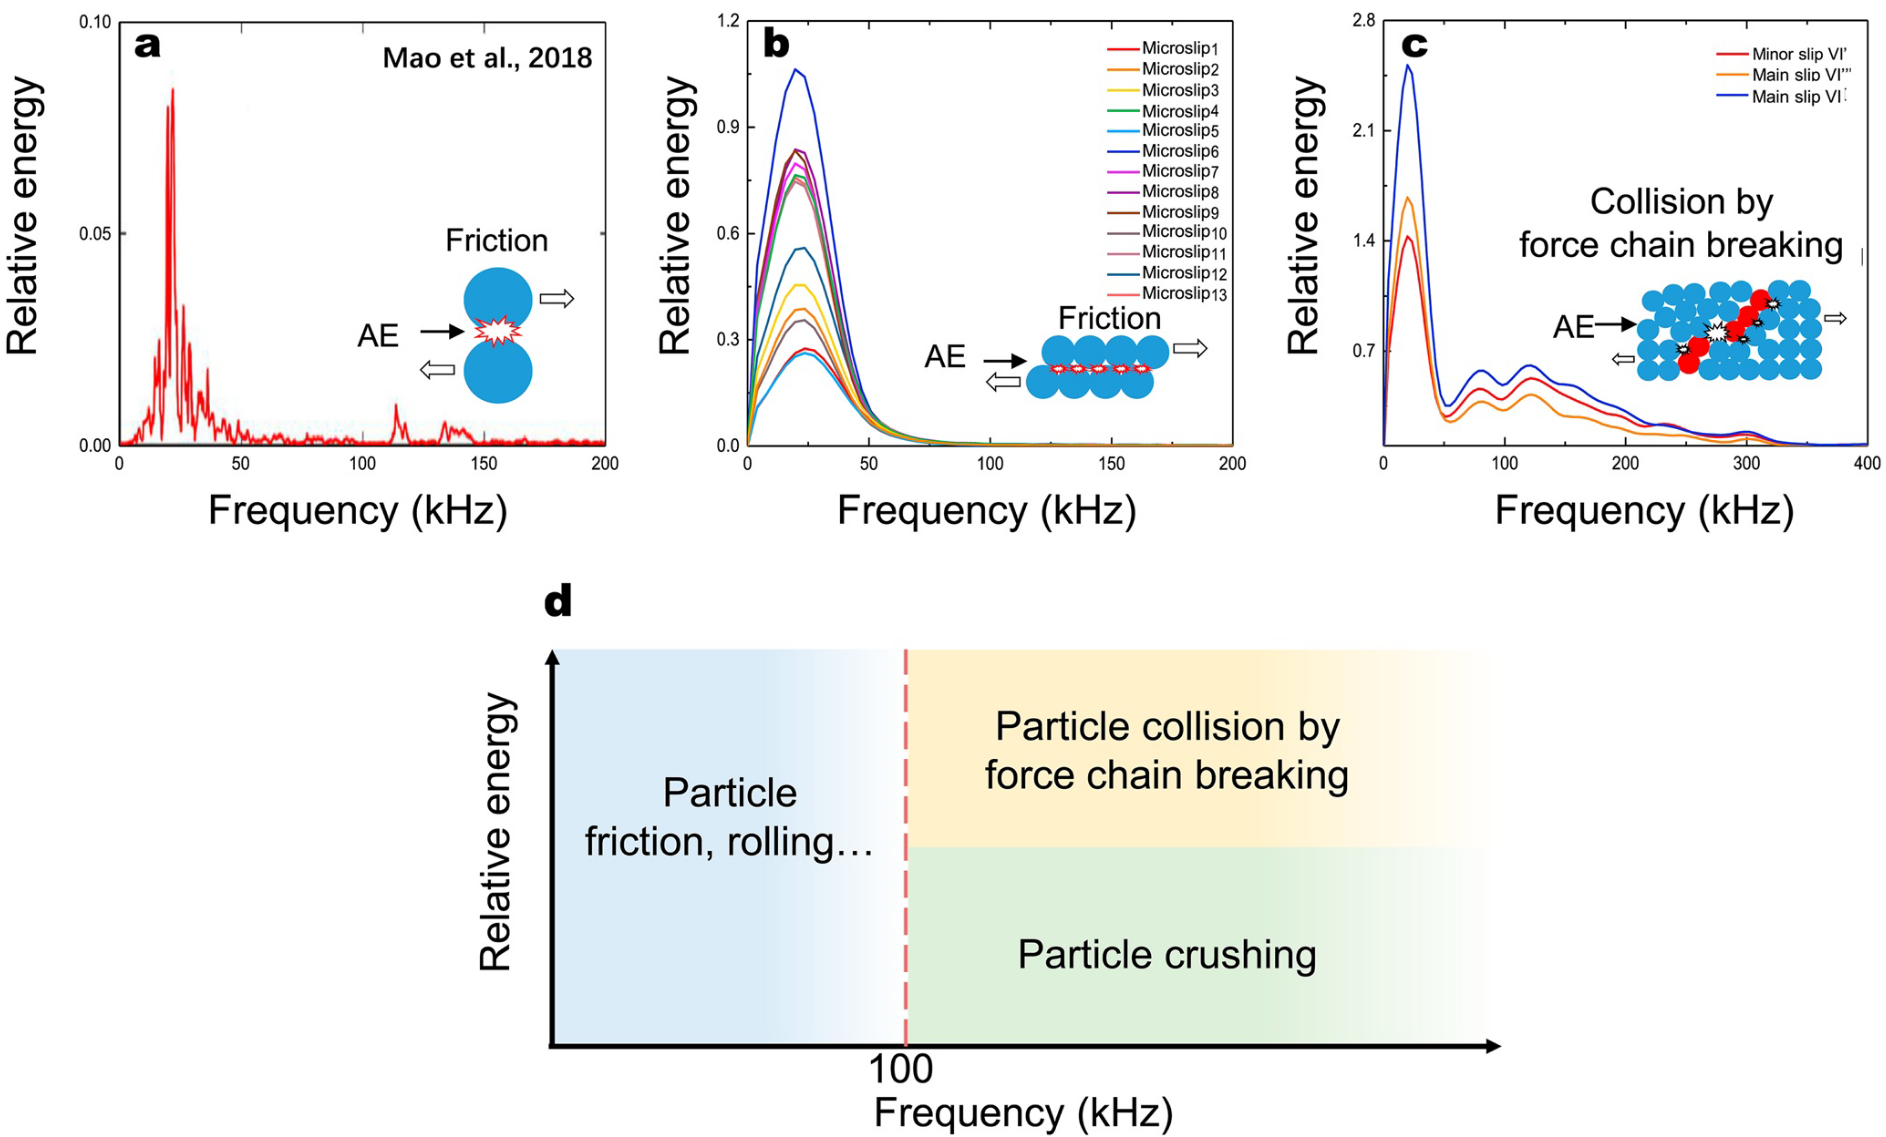
Frequency differences in acoustic emission (AE) from different particle interactions. (a) Mao et al. (2018) reported the frequency characteristics of individual particles’ friction with each other. (b) Frequency characteristics for No. 1–13 microslips of single cycle stick-slip VI. (c) Frequency characteristics for main slip and minor slip of single cycle stick-slip VI. (d) Frequency intervals of AEs generated by different particle interactions.
不同种类的颗粒相互作用产生的声发射(AE)频率差异。(a) Mao 等人(2018 年)报告了单个粒子相互摩擦的频率特性。(b) 单循环滞滑 VI 的 1-13 号微滑动的频率特性。(c) 单循环滞滑 VI 的主滑移和次滑移的频率特性。(d) 不同颗粒相互作用产生的 AE 的频率间隔。
在超高时间分辨的文章中使用的是自由落体碰撞的思路来近似颗粒间相互摩擦的过程
Mao et al. (2018) monitored the AE frequency generated by two glass beads friction (Figure 7a) and we summarized the frequency of AE associated with microslips (Figure 7b). The results show that their frequency distributions are very similar, with the main frequency around $25\text{ kHz}$ (Figures 7a and 7b), so we suggest that microslip is mainly due to frictional slip between particles.
The force chain may develop by particle friction to adjust the particle position, and the length of the force chain to increase its force capacity, and gradually strengthen it until the limit state fracture. These microslips during the nucleation stage do not trigger a global failure of the overall structure of the force chain, but are due to the inherent multi-scale structure and mechanics of granular materials (Staron et al., 2002).
Mao 等人(2018 年)监测了两颗玻璃珠摩擦产生的 AE 频率(图 7a),我们总结了与微滑移相关的 AE 频率(图 7b)。结果表明,它们的频率分布非常相似,主频都在 $25\text{ kHz}$ 左右(图 7a 和 7b),因此我们认为微滑动主要是由于颗粒之间的摩擦滑动引起的。
力链的发展可能是通过颗粒摩擦来调整颗粒位置,并通过力链的长度来增加其受力能力,逐渐加强直至极限状态断裂。成核阶段的这些微滑动并不会引发力链整体结构的全面破坏,而是由于颗粒材料固有的多尺度结构和力学特性造成的(Staron 等人,2002 年)。
With comparison between the AE frequencies emitted by various particle behaviors, we presume that the AE frequency of particles sliding or rolling is below $100\text{ kHz}$ (Figure 7d), while the AE frequency of particles colliding from the global failure of the granular system is above $100\text{ kHz}$, similar to the high AE frequency emitted by particle crushing.
通过比较各种颗粒行为发出的 AE 频率,我们推测颗粒滑动或滚动的 AE 频率低于 $100\text{kHz}$(图 7d),而颗粒体系全局破坏产生的颗粒碰撞的 AE 频率高于 $100\text{kHz}$,与颗粒破碎发出的高 AE 频率类似。
Rivière et al. (2018) had conducted friction of glass beads at different stress levels; when the normal stress was initially increased stepwise from $2$ to $8\text{ MPa}$, they could observe many micro-slip events. Then, when the normal stress was decreased from $8\text{ MPa}$ back to $2\text{ MPa}$, they observed almost no micro-slip events. We know that there are many asperities on the surface of the original particles, and the friction between particles is controlled by these asperities. As the normal stress increases, the original asperities on the particle surface will gradually be destroyed (we assume this to be plastic deformation).
Rivière等人(2018)在不同应力水平下对玻璃珠进行了摩擦试验;当法向应力最初从 $2$ 逐步增加到 $8\text{ MPa}$ 时,他们可以观察到许多微滑动事件。然后,当法向应力从 $8\text{ MPa}$ 降回到 $2\text{ MPa}$ 时,他们几乎没有观察到微滑动现象。我们知道,原始颗粒表面有许多凸起,颗粒之间的摩擦力由这些凸起控制。随着法向应力的增加,颗粒表面原有的凸起会逐渐被破坏(我们假定这是塑性变形)。
When we increased the stress stepwise from $2$ to $8\text{ MPa}$, the destruction of the original asperities increased gradually. However, if we directly apply a normal stress of $8\text{ MPa}$, all the original asperities will be suddenly destroyed. Then, when we reduce the normal stress, the destroyed asperities cannot be restored, so no microslip occurs.
当我们将应力从 $2$ 逐步增加到 $8\text{ MPa}$ 时,原始尖晶体的破坏程度逐渐增加。然而,如果我们直接施加一个 $8\text{ MPa}$ 的法向应力,所有原有的表面微尖都会被突然破坏。随后,当我们减小法向应力时,被破坏的微孔无法恢复,因此不会发生微滑移。
Therefore, we speculate that microslip is caused by the friction between particles destroying the asperities on the particle surface, slightly increasing the actual contact area between particles. We also detected slight stress strengthening based on the high-frequency collection of mechanical data.
因此,我们推测微滑动是由于颗粒之间的摩擦破坏了颗粒表面的凸面,使颗粒之间的实际接触面积略有增加。根据高频率的机械数据采集,我们还检测到了轻微的应力增强。
Comparison With Natural Faults
Although the glass beads packs used in our experiments were simplified compared to natural fault gouge, they were both granular materials and may have similar potential slip mechanisms (Åström et al., 2000). Natural fault gouge had various particle lithology, shape, and gradation, etc. We obtained stick-slip behavior similar to that exhibited by natural faults under the simplest possible conditions, using the fundamental mechanism of granular stick-slip to respond to the more universal physical mechanisms of natural faults.
In addition, the monitoring of microslip information was important for the early warning of natural fault and landslide movement. The experimental results of this study showed that the characteristic frequency of AEs associated with microslip was about 25 kHz.
虽然与天然断层破碎带相比,我们实验中使用的玻璃珠堆积有所简化,但它们都是颗粒材料,可能具有类似的潜在滑移机制(Åström 等人,2000 年)。天然断层破碎带具有不同的颗粒岩性、形状和层次等。我们在最简单的条件下获得了与天然断层相似的滞滑行为,利用颗粒滞滑的基本机制来对应天然断层更普遍的物理机制。
此外,微滑动信息的监测对于天然断层和滑坡运动的预警也非常重要。这项研究的实验结果表明,与微滑动相关的 AEs 的特征频率约为 $25\text{ kHz}$。
Then monitoring and statistics on the occurrence of AEs of about 25 kHz of frequency before the occurrence of natural faulting and combining the b-value seismic hazard assessment tools may improve the success rate of earthquake prediction. Moreover, there were still parts of the experimental results of this study that differ from natural faults.
因此,在天然断层发生前对频率约为 $25\text{ kHz}$ 的 AE 进行监测和统计,并结合 b 值地震灾害评估工具,可以提高地震预测的成功率。此外,本研究的实验结果仍有部分与天然断层存在差异。
It was shown that the stick-slip recurrence time showed a negative correlation with normal stress in Figure 3f, which were mainly similar to some other laboratory experiments, while in nature, the fault subjected to larger tectonic stress usually generates earthquakes with longer inter-event times. Our ring shear instrument cannot fully simulate the high-temperature and high-pressure conditions of deep faults, so this problem needs further study.
从图 3f 中可以看出,粘滑复发时间与法向应力呈负相关,这主要与其他一些实验室实验相似,而在自然界中,受到较大构造应力作用的断层通常会产生间隔时间较长的地震。我们的环剪仪器无法完全模拟深层断层的高温高压条件,因此这个问题还需要进一步研究。
Limitation and Future Study
In this study, the stick-slip characteristics of a sheared granular layer were investigated using the ring shear apparatus, but there are further details worth discussing in the experimental method.
The accuracy of the vertical displacement meter and the sampling rate (200 Hz) of the ARS ring shear itself were limited in this study, so we only observed the compaction of the sample when the main slip and minor slip occurred, while the microslip corresponded to a horizontal straight line in the volume change.
In the future, we plan to access the current high-frequency (2 MHz) acquisition NI system, which has enough precision in the vertical displacement meter to record the volume changes corresponding to microslip, thus perhaps revealing the accurate mechanism of microslip.
本研究使用环剪装置研究了剪切颗粒层的滞滑特性,但实验方法中还有更多细节值得讨论。
在本研究中,由于垂直位移计的精度和 ARS 环剪本身的采样率($200\text{ Hz}$)有限,所以我们只观察了主滑移和次滑移发生时样品的压实情况,而微滑移则对应于体积变化中的一条水平直线。
未来,我们计划接入目前的高频($2\text{ MHz}$)采集 NI 系统,该系统的垂直位移计精度足以记录与微滑动相对应的体积变化,从而或许能揭示微滑动的准确机理。
Although AE frequency likely helps with revealing the physical mechanisms (e.g., friction vs. collision), we should try to avoid the effects from differences in attenuation, sample type and geometry, position of the sensors relative to the sample, and sensor properties when comparing results from two different setups or different materials. These factors may induce large changes in frequency content.
虽然 AE 频率可能有助于揭示物理机制(例如摩擦与碰撞),但在比较两种不同设置或不同材料的结果时,我们应尽量避免衰减、样品类型和几何形状、传感器相对于样品的位置以及传感器特性等方面的差异所造成的影响。这些因素可能会导致频率含量的巨大变化。
We set up teeth at the bottom of the rotating cavity to transmit shear, and this design probably created a complex stress field in our glass beads packs. However, we believed that the shear force was transmitted upward through the teeth, the theoretical surface of maximum shear stress of the granular layer will be effective, and the shear zone will only appear near the shear plane (Figure 1b).
我们在旋转腔底部设置了齿来传递剪切力,这种设计可能会在玻璃珠堆积中产生复杂的应力场。但我们认为,剪切力通过齿向上传递,颗粒层的理论最大剪切应力面将会有效,剪切区只会出现在剪切面附近(图 1b)。
In fact, the shear zone in this study is hypothetical. Since the whole shear box is rotating, we cannot determine the location of AE events by attaching more AE probes near the shear plane. For future studies, we suggest the use of X-ray computed tomography to obtain the extent, morphology of shear zone and the motion of particles in the shear box, to further promote the study of shear localization in granular materials.
事实上,本研究中的剪切区是假设的。由于整个剪切盒是旋转的,我们无法通过在剪切面附近安装更多的 AE 探头来确定 AE 事件的位置。在今后的研究中,我们建议使用 X 射线计算机断层扫描来获取剪切区的范围、形态以及颗粒在剪切箱中的运动情况,以进一步促进颗粒材料剪切定位的研究。
What’s more, we hope to make a transparent modification to the ring shear cavity, to see the motion of the grains. The changes in grain contact patterns (including collision, friction, and rolling) during the stick-slip process will be studied by means of image analysis.
此外,我们还希望对环形剪切腔进行透明改装,以观察颗粒的运动。我们将通过图像分析来研究粘滑过程中颗粒接触模式的变化(包括碰撞、摩擦和滚动)。
Conclusion
We measured stress fluctuations and AEs generated by shearing uniform glass beads packs under different normal stress conditions in ring-shear experiments.
During the shearing, the AE energy release rate exhibited three stages: increasing at the beginning of shear dilatation and decreasing at the end of shear dilatation.
The maximum AE energy release rate and the highest amplitudes were generated at the peak shear resistance. Stick-slip behavior became more visible with increasing normal stress and particle size.
我们在环形剪切实验中测量了在不同法向应力条件下剪切均匀玻璃珠组时产生的应力波动和 AE。
在剪切过程中,AE 能量释放率呈现三个阶段:剪切膨胀开始时增加,剪切膨胀结束时减少。
最大 AE 能量释放率和最高振幅产生于剪切阻力峰值。随着法向应力和颗粒尺寸的增加,滞滑行为变得更加明显。
During a single cycle of a stick-slip event, stick-slip failures were accompanied by high-frequency AEs up to several hundred $\text{kHz}$, and a large stress drop. In contrast, AE frequency generated by stick-slip microslip during the nucleation stage was lower, only a few tens of $\text{kHz}$, and was accompanied by shear resistance strengthening.
在滞滑事件的单周期中,滞滑破坏伴随着高达数百 $\text{kHz}$ 的高频 AE 和较大的应力降。相比之下,成核阶段的滞滑微滑移产生的 AE 频率较低,仅为几十 $\text{kHz}$,并伴随着剪切阻力的增强。
We suggest that an internal destabilization process of granular materials may appear after the formation of the force-chain structure. First, particles broke the surface friction to strain energy accumulation (friction, rolling) and the force chain structure evolved continuously.
Before the main slip occurred, local instability produced minor slip, and finally the force chain structure broke, releasing the stored energy. The results of the study provided further understanding of the mechanical behavior of granular bodies in earthquake faults and landslide slip zones.
The corresponding AE characteristics may provide a basis for geological disaster monitoring and early warning for disaster prevention or mitigation.
我们认为,在力链结构形成之后,颗粒材料可能会出现一个内部失稳过程。首先,颗粒打破了表面摩擦的应变能积累(摩擦、滚动),力链结构连续演化。
在主滑动发生之前,局部不稳定产生了小滑移,最后力链结构断裂,释放了储存的能量。研究结果使人们进一步了解了地震断层和滑坡滑动带中颗粒体的力学行为。
相应的 AE 特征可为地质灾害监测和防灾减灾预警提供依据。
Supporting Information
Introduction
The following are supporting materials. They include: how acoustic emissions and mechanical data were simultaneously acquired; calculation of shear stress from the voltage signal corresponding to the external torque of the ring shear device; and frequency spectra of the acoustic emissions after frequency splitting. Further evidence is presented in support of mechanisms giving rise different acoustic frequencies during stick-slip behavior.
以下是辅助材料。其中包括:如何同时获取声发射和机械数据;根据与环形剪切装置外部扭矩相对应的电压信号计算剪切应力;以及分频后的声发射频谱。研究还进一步证明了在滞滑行为中产生不同声频的机制。
Simultaneous data acquisition
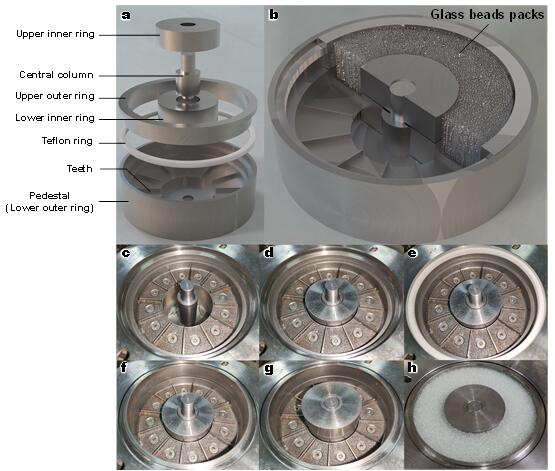
a,-b. Schematic diagram of 3D structure of shearing box; c.-h. The installation of the rotating cavity and loading of the sample.
a,-b.剪切箱的三维结构示意图;c.-h.旋转腔的安装和样品的装载。
To facilitate the understanding of how glass beads are held or contained, Figure S1 shows the assembly process of the annular sample holder and the sample loading process. The annular sample holder is made of two (equal size) annular cavities installed on top of each other. We can see the composition of all the parts of the shear box after disassembly (Figure S1a.) and the contact between the sample and the rotating cavity after loading (Figure S1b.) in the 3D schematic of the shear box.
为了便于理解玻璃珠是如何固定或容纳的,图 S1 展示了环形样品架的组装过程和样品装载过程。环形样品架由两个(大小相等的)环形腔体相互安装而成。我们可以从剪切盒的三维示意图中看到拆卸后剪切盒所有部件的组成(图 S1a)以及装载后样品与旋转腔体的接触情况(图 S1b)。
After the shear box was completely disassembled, only the outer wall of the rotating lower cavity remained (Figure S1c.) and the bottom of the rotating lower cavity was evenly distributed with 12 teeth to increase the frictional coupling with the sample. We first installed the inner ring of the rotating lower cavity (Figure S1d.), with a slightly larger diameter annular platform above the rotating lower cavity. Then we mounted a Teflon ring of a certain thickness with the same bottom area on the platform (Figure S1e.).
剪切盒完全拆卸后,只剩下旋转下腔的外壁(图 S1c.),旋转下腔的底部均匀分布着 $12$ 个齿,以增加与样品的摩擦耦合。我们首先安装了旋转下腔的内环(图 S1d.),旋转下腔上方是一个直径稍大的环形平台。然后,我们在平台上安装了一个具有相同底部面积的一定厚度的特氟龙环(图 S1e.)。
On the Teflon ring we continued to install the outer ring of the rotating upper cavity (Figure S1f.) and finally we installed the inner ring of the rotating upper cavity (Figure S1g.).
After installation of the shear box, there are two annular gaps of the same height between the inner and outer walls of the upper and lower annular cavities and the thickness of the annular gaps is smaller than the particle diameter.
Before the experiment, we put the glass beads into the annular sample holder (Figure S1h.). We added a video to describe the shearing process (see Supplementary Video 1).
在特氟龙环上,我们继续安装旋转上腔的外环(图 S1f.),最后安装旋转上腔的内环(图 S1g.)。
安装剪切盒后,上下环形腔的内外壁之间有两个高度相同的环形间隙,环形间隙的厚度小于颗粒直径。
实验前,我们将玻璃珠放入环形样品架中(图 S1h.)。我们添加了一段视频来描述剪切过程(见补充视频 1)。
如何考虑这里制备历史/协议的影响因素 ?
Mechanical data transformation
The original experimental data from this study were output from three acquisition systems: the ARS ring shear; the NI acquisition system; and Express-8 point-triggered acoustic emission acquisition system.
Figure S2a. shows the variations in shear resistance and vertical displacement with time collected by the acquisition system that came with the ARS ring shear, (sampling frequency, $100 \text{Hz}$). Normal stress, shear resistance and shear displacement of the ring shear in this experiment were calculated from the vertical force $W$, torque $M$ and angular displacement $\theta$ (Figure S3a.). In Figure S3b., it was assumed that the normal stress $\sigma_{m}$ and shear resistance $\tau_{m}$ were uniformly distributed on the shear surface.
The normal stress was calculated by Equation (1):
$$ \sigma_{m} = \frac{W}{\pi(R_{2}^{2}-R_{1}^{2})} $$
where $R_{1}$ and $R_{2}$ are the inner ring radius and outer ring radius of the annular sample, respectively.
本研究的原始实验数据由三个采集系统输出:ARS 环剪、NI 采集系统和 Express-8 点触发声发射采集系统。
图 S2a.显示了ARS环形剪切机自带的采集系统采集到的剪切阻力和垂直位移随时间的变化(采样频率为 $100 \text{Hz}$)。本实验中环剪的法向应力、剪切阻力和剪切位移由垂直力 $W$、扭矩 $M$ 和角位移 $\theta$ 计算得出(图 S3a.)。在图 S3b 中,假定法向应力 $\sigma_{m}$ 和剪切阻力 $\tau_{m}$ 在剪切面上均匀分布。
法向应力由公式 (1) 计算得出:
$$ \sigma_{m} = \frac{W}{\pi(R_{2}^{2}-R_{1}^{2})} $$
其中,$R_{1}$ 和 $R_{2}$ 分别是环形样品的内环半径和外环半径。
From the torque $M = \int_{R_{1}}^{R_{2}}\tau_{m}\times 2\pi R^{2}\mathrm{d}R$, the average shear resistance on the shear surface was obtained as:
$$ \tau_{m} = \frac{3M}{2\pi(R_{2}^{3}-R_{1}^{3})} $$
The average shear displacement in the shear surface was:
$$ S = \pi D_{m}\times v\times t = \frac{D_{m}}{2}\theta = R_{m}\theta $$
where $D_{m}$ is the diameter of the sample, $R_{m}$ is the radius of the sample, $v$ is the rotational speed (rpm), and $t$ is elapsed time(s).
从扭矩 $M = \int_{R_{1}}^{R_{2}}\tau_{m} \times 2\pi R^{2}\mathrm{d}R$ 可得出剪切面上的平均剪切阻力:
$$ \tau_{m} = \frac{3M}{2\pi(R_{2}^{3}-R_{1}^{3})} $$
剪切面的平均剪切位移为
$$ S = \pi D_{m}\times v\times t = \frac{D_{m}}{2}\theta = R_{m}\theta $$
其中,$D_{m}$ 为样品直径,$R_{m}$ 为样品半径,$v$ 为转速(转/分),$t$ 为所用时间(秒)。
From the friction coefficient $\mu = \frac{\sigma_{m}}{\tau_{m}} = W\times\frac{R_{m}}{M}$, can be derived:
$$ D_{m} = 2R_{m} = 2\times \frac{2(R_{2}^{3} - R_{1}^{3})}{3(R_{2}^{2} - R_{1}^{2})} $$
从摩擦系数 $\mu = \frac{\sigma_{m}}{\tau_{m}} = W\times\frac{R_{m}}{M}$ 可以得出:
$$ D_{m} = 2R_{m} = 2\times \frac{2(R_{2}^{3} - R_{1}^{3})}{3(R_{2}^{2} - R_{1}^{2})} $$
Mechanical model of ring-shear device. a. Mechanical model of ARS ring shear and distribution of various sensors. b. Stress calculation model of ring shear experiment.
a. ARS 环形剪切装置的机械模型和各种传感器的分布情况。 b. 环形剪切实验的应力计算模型。
这里的声学探头的位置真的能够采集到合理的信号吗 ? 如何考虑去除这些影响因素 ?
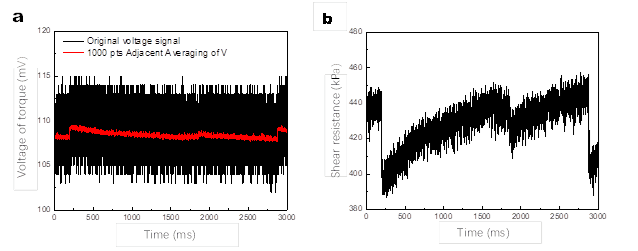
Figure S2b.c. are the original acoustic emission and mechanical signals acquired simultaneously by the NI system with a sampling frequency of $2 \text{ MHz}$. The acoustic emission signal is amplitude versus time, and the mechanical signal is the voltage corresponding to the torque versus time.
图 S2b.c. 是 NI 系统同时采集的原始声发射信号和机械信号,采样频率为 $2 \text{ MHz}$。声发射信号是振幅与时间的关系,机械信号是扭矩对应的电压与时间的关系。
Due to the high sampling frequency and the large amount of data for both signals, we did not edit or calculate the entire signal, but performed a simple adjacent-averaging process on the mechanics voltage signal. Figure S2d. shows the acoustic emission signal acquired by Express-8, which takes the acoustic emission events with amplitude greater than $40 \text{ dB}$ during the shear process, to generate a data point.
由于两个信号的采样频率高、数据量大,我们没有对整个信号进行编辑或计算,而是对力学电压信号进行了简单的邻接平均处理。图 S2d.显示了 Express-8 获取的声发射信号,它将剪切过程中振幅大于 $40 \text{ dB}$ 的声发射事件作为一个数据点。
We accumulated the energy produced by the acoustic events represented by each data point for analysis. Only the acoustic emission signal was synchronized with the mechanical voltage signal acquired by the NI system, while the ARS ring shear, NI system, and Express-8 system were manually timed to each other when acquiring data, and may have errors of fractions of a second.
我们将每个数据点所代表的声学事件产生的能量累积起来进行分析。只有声发射信号与 NI 系统获取的机械电压信号是同步的,而 ARS 环剪、NI 系统和 Express-8 系统在获取数据时是 相互手动对时 的,因此可能存在几分之一秒的误差。
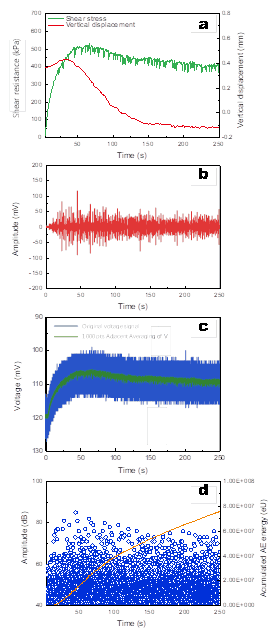
Original data of various signals under simultaneous acquisition. a. Variation in shear resistance and vertical displacement with time obtained from the ARS ring shear. b. Acoustic emission amplitude versus time for the National Instrument (NI) system high-frequency acquisition ($2\text{ MHz}$). c. Voltage corresponding to the torque versus time acquired at $2\text{ MHz}$ by the NI system. d. Relationships between amplitude of point-triggered acoustic emissions, accumulated AE energy and time acquired by the Express-8 system.
同时采集 各种信号的原始数据. a. 从 ARS 环形剪切中获得的抗剪力和垂直位移随时间的变化; b. 国家仪器(NI)系统高频采集($2\text{ MHz}$)的声发射振幅与时间的关系; c. NI 系统以 $2\text{ MHz}$ 频率采集的扭矩随时间变化的相应电压; d. 点触发声发射的振幅、累积的 AE 能量和 Express-8 系统获取的时间之间的关系。
Based on the experimental results of Figure 2 in the main text, we plotted the stress ratios (friction coefficient) in the same coordinates as the shear displacement. The results are shown in the Figure S4.
根据正文图 2 的实验结果,我们绘制了与剪切位移相同坐标的比应力(摩擦系数)。结果如图 S4 所示。
Friction coefficient versus shear displacement for $1\text{ mm}$ glass beads at $3\text{ mm/min}$ at different normal stress.
$1$ 毫米玻璃珠在不同法向应力下以 $3$ 毫米/分钟的速度运动时的摩擦系数与剪切位移的关系。
Mechanical and acoustic emission signals of a single stick-slip behavior were acquired simultaneously by the NI system. a. Voltage and acoustic emission signals of a single stick-slip behavior with time. b. The variation of shear resistance from voltage conversion and acoustic emission signals over time.
NI 系统同时采集了单次滞滑行为的机械和声发射信号. a. 单个滞滑行为的电压和声发射信号随时间变化. b. 电压转换和声发射信号的剪切阻力随时间的变化.
Due to the huge amount of data collected at high frequency, we selected two signals of a single stick-slip behavior for processing (taking the stick-slip behavior VI mentioned in the main text as an example). As shown in Figure S4 a., the original voltage signal corresponding to the torque was relatively coarse, and we first smoothed the original voltage by using adjacent-averaging (window averaging, that is, averaging over neighboring points). When the smoothing method was adjacent-averaged, each smoothed data point was computed from data points within a moving window.
由于高频采集的数据量巨大,我们选取了两个单一滞滑行为的信号进行处理(以正文中提到的滞滑行为 VI 为例)。如图 S4 a.所示,扭矩对应的原始电压信号相对粗糙,我们首先使用相邻平均法(窗口平均法,即对相邻点进行平均)对原始电压进行平滑处理。采用相邻平均法时,每个平滑数据点都是由移动窗口内的数据点计算得出的。
Let $\{f_{i}|i=1,2,…,N\}$ be the input data points and let $\{g_{i}|i=1,2,…,N\}$ denote the output data points. Each $g_{i}$ was computed from $\{f_{m}|i-\text{floor(npts)}/2 < m < i + \text{floor(npts)}/2\}$. where $\text{npts}$ is the value of the points of the window variable.
The adjacent-averaging method uses the simplest possible averaging procedure: each $g_{i}$ is the average of the data points within the moving window. If the weighted average option is used, the average will be computed using weighted averaging.
让 $\{f_{i}|i=1,2,…,N\}$ 表示输入数据点,让 $\{g_{i}|i=1,2,…,N\}$ 表示输出数据点。每个 $g_{i}$ 都由 $\{f_{m}|i-\text{floor(npts)}/2 < m < i + \text{floor(npts)}/2\}$ 计算得出,其中 $\text{npts}$ 是窗口变量的点值。
相邻平均法使用的是最简单的平均程序:每个 $g_{i}$ 都是移动窗口内数据点的平均值。如果使用加权平均选项,平均值将使用加权平均法计算。
In this case, a parabolic weight is used, with the weight area normalized to 1. For a window whose center is in $i$ (which means to calculate the $i$ th averaged point), the weight which corresponds to the $j$ th ($j=0, 1, … \text{npts}-1$) point is:
$$ w_{j} = 1 - \left(\frac{(j-i)^{2}}{(N + 1)/2}\right)^{2} $$
where $N$ is the number of Points of Window.
在这种情况下,使用抛物线权重,权重区域归一化为 1。对于中心位于 $i$(即计算第 $i$ 个平均点)的窗口,与第 $j$ 个($j=0, 1, … \text{npts}-1$)点相对应的权重为:
$$ w_{j} = 1 - \left(\frac{(j-i)^{2}}{(N + 1)/2}\right)^{2} $$
其中,$N$ 是窗口点的数量。
Because shear resistance is positively correlated with torque and smoothing the voltage corresponding to torque does not change the trend of torque, we used a positive correlation function to fit the shear stress collected by the NI system to the smoothed voltage variation, in combination with the shear resistance calculated in the ARS ring shear.
由于剪切阻力与扭矩呈正相关,而平滑扭矩对应的电压不会改变扭矩的趋势,因此我们使用正相关函数将 NI 系统收集的剪切应力与平滑电压变化拟合,并结合 ARS 环剪计算的剪切阻力。
The shear stress $\tau = \Delta V\times k = (V_{0} - V)\times k$, where $V_{0}$ is the initial voltage value when the shear stress is 0 and $V$ is the current moment voltage value. In the ARS ring-shear device, an increase in torque corresponds to a decrease in voltage (Figure S2c.), so the initial voltage is subtracted from the current voltage. The result of the fit, $k$, is approximately equal to 37, and the calculated shear resistance for this stick-slip behavior as a function of time is shown in Figure S4b.
剪切应力 $\tau = \Delta V\times k = (V_{0} - V)\times k$,其中 $V_{0}$ 为剪切应力为 $0$ 时的初始电压值,$V$ 为当前力矩电压值。在 ARS 环剪装置中,扭矩的增加对应于电压的降低(图 S2c.),因此要从当前电压中减去初始电压。拟合结果 $k$ 约等于 $37$,计算出的这种滞滑行为的剪切阻力与时间的函数关系如图 S4b 所示。
Acoustic emission frequency splitting
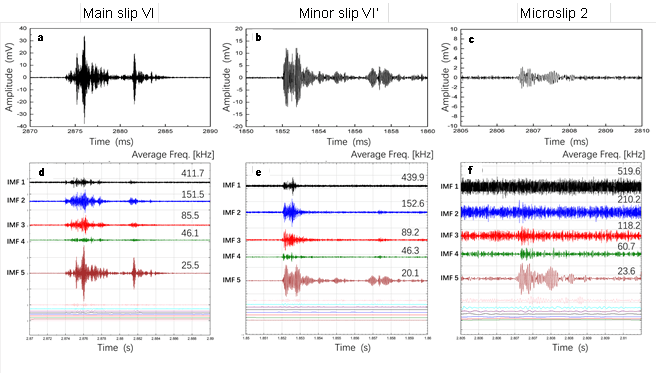
Waveforms of the three acoustic emission signals and their EMD decomposition results. a.c.e. are the waveforms (amplitude versus time) of the acoustic emission signals corresponding to the main failure, minor failure, and precursor microslip event No. 2 of the VI stick-slip, respectively. b.d.f. are the spectra of these three signals after the EMD decomposition, containing waveform characteristics and average frequency of each frequency band.
a.c.e. 是分别与 VI 号滞滑的主要故障、次要故障和 2 号前兆微滑移事件相对应的声发射信号的波形(振幅与时间关系)。b.d.f. 是这三个信号经 EMD 分解后的频谱,包含每个频段的波形特征和平均频率。
We selected some acoustic emission signals of the stick-slip behavior of VI mentioned in the main text to illustrate the acoustic emission frequency splitting. We selected three representative acoustic emission signals, which were the signals corresponding to the main failure, minor failure and a precursor microslip event No. 2 of stick-slip behavior VI, as shown in Figure S5a.c.e.. They differed in amplitude, energy and duration, and we wanted to further analyze their frequency characteristics.
我们选择了正文中提到的 VI 滞滑行为的一些声发射信号来说明声发射频率分裂。我们选取了三个具有代表性的声发射信号,它们分别对应于滞滑行为 VI 的主破坏、次破坏和前兆微滑事件 2,如图 S5a.c.e.所示。它们在振幅、能量和持续时间上各不相同,我们希望进一步分析它们的频率特性。
With the EMD technique, the signal was decomposed into a set of oscillatory components, i.e. intrinsic mode functions (IMFs), each with a different frequency content, which may highlight different process information. The model was obtained using a data-driven approach with no assumptions about the generation process. The signals were decomposed in 12 IMFs, and an example of the decomposition is shown in Figure S5b.d.f..
利用 EMD 技术,信号被分解成一系列振荡成分,即固有模式函数(IMF),每个成分的频率含量不同,可能突出不同的过程信息。该模型采用数据驱动法,不对信号产生过程做任何假设。信号被分解为 12 个 IMF,分解示例见图 S5b.d.f。
They were characterized by a frequency decrease, and we found IMF1~IMF5 reflected the main frequency characteristics, and the subsequent IMFs only described the signal trend (Han and Van der Baan, 2013). The use of this tool seemed to be the most reasonable choice in this study because the evolution time of the process was short and therefore the traditional short-term Fourier transform caused information interference compared to the instantaneous coherent frequency determination of the Hilbert-Huang transform.
我们发现 IMF1~IMF5 反映了主要的频率特性,随后的 IMF 只描述了信号的趋势(Han 和 Van der Baan,2013 年)。在本研究中,使用这一工具似乎是最合理的选择,因为过程的演变时间很短,因此与 Hilbert-Huang 变换的瞬时相干频率测定相比,传统的短期傅里叶变换会造成信息干扰。
We found that the acoustic emissions corresponding to the stick-slip main failure and minor failure exhibited characteristic waveforms in the IMF1-IMF5 band after frequency division, with the highest frequency up to about 439.9 kHz and the lowest frequency about 20.1 kHz. Therefore, for these two signals, we superimposed the five signals in the IMF1-IMF5 band, and then performed a Short-time Fourier transform on the superimposed signals. Finally, we obtained the time-frequency diagram shown in Figure 5 in the text.
我们发现,在 IMF1-IMF5 频段,与滞滑主故障和次故障相对应的声发射在分频后呈现出特征波形,最高频率可达约 439.9 kHz,最低频率约为 20.1 kHz。因此,针对这两个信号,我们将 IMF1-IMF5 频段的五个信号叠加,然后对叠加后的信号进行短时傅里叶变换。最后,我们得到了文中图 5 所示的时频图。
For the acoustic emission signal (Figure S5e.), we saw that it did not show waveform characteristics in the high frequency band such as IMF1, but only showed obvious waveform characteristics in the IMF5 band and weakly in the IMF4 band. Therefore, for this kind of precursor microslip signal, we only superimposed the 2 signals in the IMF4 and IMF5 bands, and then performed a Short-time Fourier transform to obtain the time-frequency diagram.
对于声发射信号(图 S5e.),我们看到它在 IMF1 等高频段没有表现出波形特征,只在 IMF5 频段表现出明显的波形特征,在 IMF4 频段表现较弱。因此,对于这种前兆微滑动信号,我们只将 IMF4 和 IMF5 波段的两个信号叠加,然后进行短时傅里叶变换,得到时频图。
Further results on the frequency difference between the mechanics and the corresponding acoustic emissions similar to the stick-slip behavior VI
Experimental results similar to those shown in Figure 4 in the main text are shown below to further support the difference in the response acoustic emission frequencies of the stick-slip behavior controlled by the two mechanical mechanisms, as shown in Figs.S6 and S7.
与正文中图 4 所示结果类似的实验结果如下,以进一步证明两种机械机制控制的滞滑行为的响应声发射频率存在差异,如图 S6 和 S7 所示。
Waveforms of the three acoustic emission signals and their EMD decomposition results. a.c.e. are the waveforms (amplitude versus time) of the acoustic emission signals corresponding to the main failure, minor failure, and precursor microslip event No. 2 of the VI stick-slip, respectively. b.d.f. are the spectra of these three signals after the EMD decomposition, containing waveform characteristics and average frequency of each frequency band.
a.c.e. 是分别与 VI 号滞滑的主要故障、次要故障和 2 号前兆微滑移事件相对应的声发射信号的波形(振幅与时间关系)。b.d.f. 是这三个信号经 EMD 分解后的频谱,包含每个频段的波形特征和平均频率。
Synchronous comparisons between AE and mechanical signals of the main slips, minor slip, and microslips within No.Ⅳ single cycle stick-slip. The results of two main slips, one minor slip, and three selected representative microslips in No. Ⅳ stick-slip are shown. The No.3, 4, and 8 microslips occurred at different periods of the single cycle stick-slip. a. e. i. m. q. u. AE waveforms of main slips, minor slip, and microslips (AE amplitude versus time). b. f. j. n. r. v. AE frequency as a function of time. c. g. k. o. s. w. Frequency marginal spectrum of AEs. d. h. l. p. t. x. Shear resistance as a function of time.
第Ⅳ号单周期粘性滑移中主滑移、次滑移和微滑移的 AE 信号与机械信号的同步比较。图中显示了Ⅳ号滞滑中两个主滑移、一个次滑移和三个选定的代表性微滑移的结果。a.E.I.M.Q.U.主滑移、小滑移和微滑移的 AE 波形(AE 振幅与时间的关系)b.F.J.N.R.V.AE 频率与时间的关系c.G.K.O.S.W.AE 的边际频谱。 D. H. L. P. T. X. 抗剪切力与时间的函数关系。
Synchronous comparisons between AE and mechanical signals of the main slips, minor slip, and microslips within No.Ⅴ single cycle stick-slip. The results of two main slips, one minor slip, and three selected representative microslips in No.Ⅴ stick-slip are shown. The No.1, 2, and 4 microslips occurred at different periods of the single cycle stick-slip. a. e. i. m. q. u. AE waveforms of main slips, minor slip, and microslips (AE amplitude versus time). b. f. j. n. r. v. AE frequency as a function of time. c. g. k. o. s. w. Frequency marginal spectrum of AEs. d. h. l. p. t. x. Shear resistance as a function of time.
第Ⅴ号单周期粘性滑移中主滑移、次滑移和微滑移的 AE 信号与机械信号的同步比较。图中显示了第Ⅴ号滞滑中两个主滑、一个次滑和三个选定的代表性微滑的结果。a.E.I.M.Q.U.主滑移、小滑移和微滑移的 AE 波形(AE 振幅与时间的关系)b.F.J.N.R.V.AE 频率与时间的关系c.G.K.O.S.W.AE 的边际频谱。 D. H. L. P. T. X. 抗剪切力与时间的函数关系。
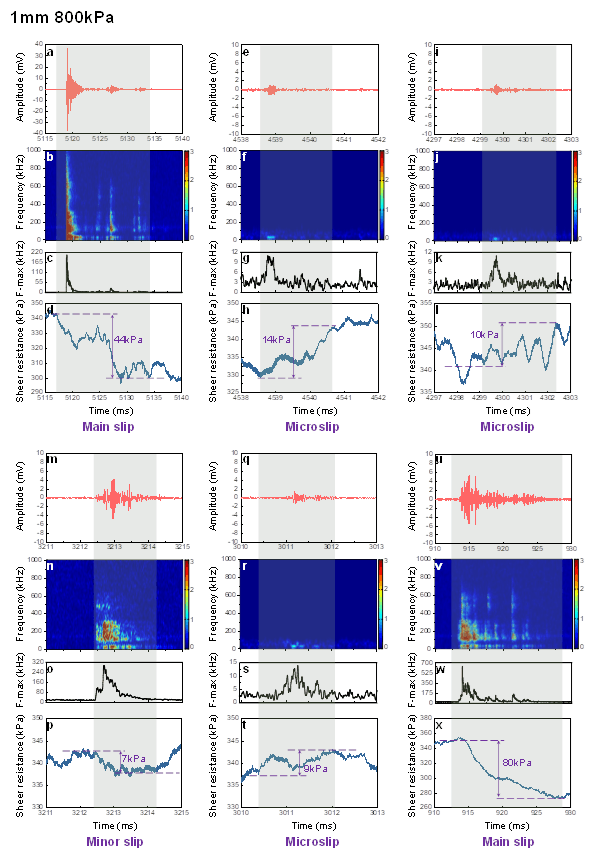
Synchronous comparisons between AE and mechanical signals of the main slips, minor slip, and microslips within a single cycle stick-slip for 1 mm, 800 kPa conditions. The results of two main slips, one minor slip, and three selected representative microslips in No.Ⅴ stick-slip are shown. The microslips occurred at different periods of the single cycle stick-slip. a. e. i. m. q. u. AE waveforms of main slips, minor slip, and microslips (AE amplitude versus time). b. f. j. n. r. v. AE frequency as a function of time. c. g. k. o. s. w. Frequency marginal spectrum of AEs. d. h. l. p. t. x. Shear resistance as a function of time.
在 1 mm、800 kPa 条件下,单循环滞滑中主滑移、次滑移和微滑移的 AE 和机械信号的同步比较。图中显示了 No.Ⅴ 滞滑中两个主滑移、一个次滑移和三个选定的代表性微滑移的结果。a. e. i. m. q. u. 主滑移、次滑移和微滑移的 AE 波形(AE 振幅与时间的关系)。 b. f. j. n. r. v. AE 频率与时间的关系。AE 的边际频谱。 D. H. L. P. T. X. 抗剪切力与时间的函数关系。
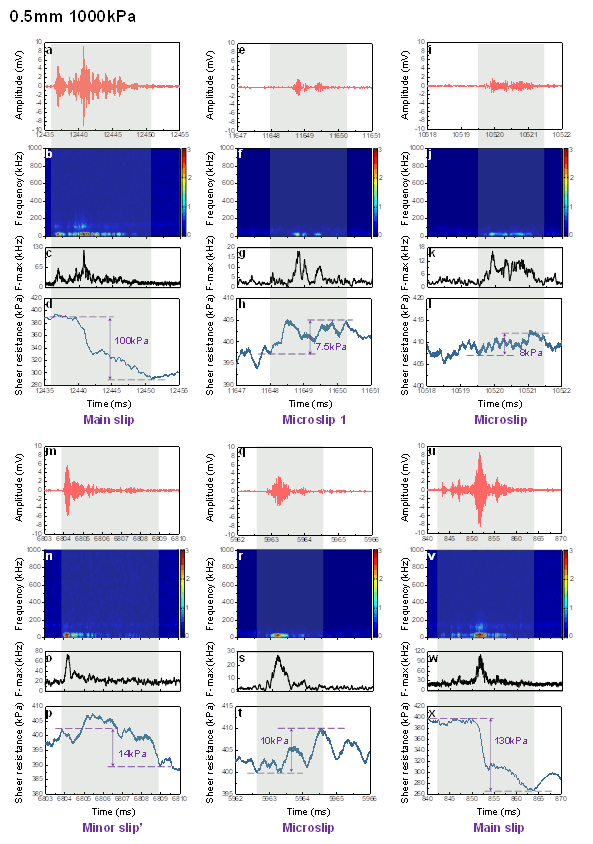
Synchronous comparisons between AE and mechanical signals of the main slips, minor slip, and microslips within a single cycle stick-slip for 0.5 mm, 1000 kPa conditions. The results of two main slips, one minor slip, and three selected representative microslips in No.Ⅴ stick-slip are shown. The microslips occurred at different periods of the single cycle stick-slip. a. e. i. m. q. u. AE waveforms of main slips, minor slip, and microslips (AE amplitude versus time). b. f. j. n. r. v. AE frequency as a function of time. c. g. k. o. s. w. Frequency marginal spectrum of AEs. d. h. l. p. t. x. Shear resistance as a function of time.
在 0.5 mm、1000 kPa 条件下,单周期滞滑中主滑移、次滑移和微滑移的 AE 和机械信号的同步比较。图中显示了 No.Ⅴ 滞滑中两个主滑移、一个次滑移和三个选定的代表性微滑移的结果。a. e. i. m. q. u. 主滑移、次滑移和微滑移的 AE 波形(AE 振幅与时间的关系)b. f. j. n. r. v. AE 频率与时间的关系c. g. k. o. s. w.AE 的边际频谱。 D. H. L. P. T. X. 抗剪切力与时间的函数关系。
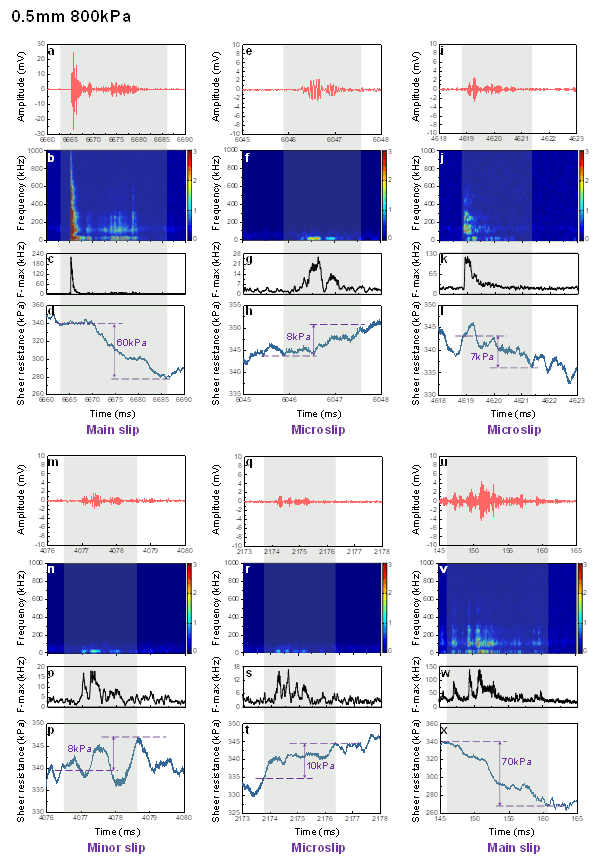
Synchronous comparisons between AE and mechanical signals of the main slips, minor slip, and microslips within a single cycle stick-slip for 0.5 mm, 80 0kPa conditions. The results of two main slips, one minor slip, and three selected representative microslips in No.Ⅴ stick-slip are shown. The microslips occurred representatively at different periods of the single cycle stick-slip. a. e. i. m. q. u. AE waveforms of main slips, minor slip, and microslips (AE amplitude versus time). b. f. j. n. r. v. AE frequency as a function of time. c. g. k. o. s. w. Frequency marginal spectrum of AEs. d. h. l. p. t. x. Shear resistance as a function of time.
在 0.5 mm、80 0kPa 条件下,单周期滞滑中主滑移、次滑移和微滑移的 AE 和机械信号的同步比较。图中显示了 No.Ⅴ 滞滑中两个主滑移、一个次滑移和三个选定的代表性微滑移的结果。a. e. i. m. q. u. 主滑移、小滑移和微滑移的 AE 波形(AE 振幅与时间的关系)。 b. f. j. n. r. v. AE 频率与时间的关系。AE 的边际频谱。 D. H. L. P. T. X. 抗剪切力与时间的函数关系。
We also selected other experimental results with significant stick-slip behavior under normal stress and grain size conditions (0.8-1 mm, 800 kPa, 0.4-0.6 mm, 1000 kPa, 0.4-0.6 mm, 800 kPa), doing similar analyses and found the same acoustic emission frequency difference phenomenon and precursor microslip mechanical strengthening behavior.
我们还选取了在法向应力和颗粒尺寸条件下(0.8-1 mm,800 kPa;0.4-0.6 mm,1000 kPa;0.4-0.6 mm,800 kPa)具有明显滞滑行为的其他实验结果,进行了类似的分析,发现了相同的声发射频率差异现象和前兆微滑机械强化行为。
In addition, we also show the background signal without any obvious acoustic events corresponding to the same scale, as shown in Figure S11, which shows that the spectrum is relatively clean and the mechanical changes are relatively smooth.
此外,我们还显示了没有任何明显声学事件的背景信号,对应相同的比例,如图 S11 所示,这表明频谱相对干净,机械变化相对平滑。