Significance
The faults slip abruptly to cause catastrophic fast earthquakes, while slow earthquakes gently release energy. Understanding the slip process in the granular assemblies is important for revealing the slip mechanism of real fault.
Different from previous laboratory observations of only dilation or compaction in the fast slips, we first found the detailed variation of granular fault thickness at ultrahigh temporal resolution: Compaction occurred first, then accompanied by dilation and vibration, and finally slow compaction initiated after cessation of the fast slip.
We also observed the dilation of slow slip in the laboratory. These dilation events of fast and slow slips were also observed in natural earthquakes, which have implications for understanding mechanisms underlying fault slip instabilities.
断层突然滑动会引发灾难性的快速地震,而缓慢地震则会温和地释放能量。了解颗粒集合体的滑动过程对于揭示真实断层的滑动机制非常重要。
与以往实验室观测到的快速滑动中只有扩张或压实不同,我们首次在超高时间分辨率下发现了颗粒状断层厚度的详细变化:压实首先发生,然后伴随着扩张和振动,最后在快速滑动停止后开始缓慢压实。
我们还在实验室观察到了慢滑的扩张。在自然地震中也观察到了这些快速和慢速滑动的扩张事件,这对了解断层滑动不稳定性的内在机制具有重要意义。
Abstract
Fast and slow earthquakes are two modes of energy release by the slip in tectonic fault rupture. Although fast and slow slips were observed in the laboratory stick–slip experiments, due to the sampling rate limitation, the details of the fault thickness variation were poorly understood. Especially, why a single fault would show different modes of slip remains elusive. Herein, we report on ring shear experiments with an ultrahigh sampling rate (10 MHz) that illuminate the different physical processes between fast and slow slip events.
快震和慢震是构造断层破裂时滑动释放能量的两种模式。虽然在实验室粘滑实验中观测到了快慢两种滑动,但由于采样率的限制,人们对断层厚度变化的细节了解甚少。特别是,为什么一个断层会出现不同的滑动模式,至今仍是个谜。在此,我们报告了超高采样率($10\text{ MHz}$)的环剪切实验,该实验揭示了快速和慢速滑移事件之间的不同物理过程。
We show that the duration of slips ranged from dozens to hundreds of milliseconds. Fast slip events are characterized by continuous large-amplitude AE (acoustic emission) and somewhat intricate variation of the sample thickness: A short compaction pulse during the rapid release of stress is followed by dilation and vibrations of the sample thickness.
我们发现,滑移持续时间从几十毫秒到几百毫秒不等。快速滑移事件的特点是连续的大振幅声发射(AE)和样品厚度的复杂变化:在快速释放应力的过程中会产生一个短的压实脉冲,随后样品厚度会发生膨胀和振动。
As the slip ends, the thickness of the sample first recovers by slow compaction and then dilates again before nucleation of the following slip event.
In contrast, during slow slip events, the shear stress reduction is accompanied by intermit- tent bursts of low-amplitude AE and sample dilation. We observed the detailed thickness variation during slips and found that dilation occurs during both fast and slow slips, which is consistent with natural observations of coseismic dilatation.
This study may be used to reveal the mechanism of fault slips during fast and slow earthquakes, which explain the potential effect of fast and slow slips on stress redistribution and structural rearrangement in faults.
当滑移结束时,样品厚度首先通过缓慢压实恢复,然后在下一次滑移事件成核之前再次膨胀。
与此相反,在缓慢的滑移过程中,剪切应力的降低伴随着低振幅 AE 的间歇爆发和样品的膨胀。我们观察了滑动过程中的详细厚度变化,发现快速和慢速滑动过程中都会发生膨胀,这与共震扩张的自然观测结果一致。
这项研究可用于揭示快、慢地震时断层滑动的机理,从而解释快、慢滑动对断层应力重新分布和结构重排的潜在影响。
Introduction
Fast earthquakes and slow earthquakes are two modes of tectonic fault slip with different energy release durations. Fast earthquakes are often accompanied by catastrophic ground motion, causing a serious disaster.
While fast earthquakes are conventional fast tectonic fault earthquakes with catastrophic slip failure, earthquakes with slow slip failure that last several hours to months have also been observed in the field, such as low-frequency earthquakes and slow slip earthquakes.
快震和慢震是两种能量释放持续时间不同的构造断层滑动模式。快震往往伴随着灾难性的地面运动,造成严重灾害。
快地震是具有灾难性滑动破坏的常规快速构造断层地震,但在野外也观测到持续数小时至数月的慢滑动破坏地震,如低频地震和慢滑动地震。
Although slow earthquakes do not cause catastrophic ground motion, their process of slow stress release may play roles in stress transfer and stress redistribution in faults, potentially triggering fast earthquakes. Fast earthquakes and slow earthquakes have been frequently observed in situ, but field seismic studies are difficult to carry out. Fault stick–slip is a possible significant mechanism for earthquakes.
虽然慢地震不会引起灾难性的地面运动,但其缓慢的应力释放过程可能会在断层的应力传递和应力再分布中发挥作用,从而可能引发快地震。人们经常在原地观测到快震和慢震,但野外地震研究很难开展。断层粘滑可能是引发地震的一个重要机制。
Many laboratory earthquake simulations have studied the mechanism of fast and slow slip events with physical stick–slip experiments and numerical simulations. Recent observations suggest that fast and slow slip modes were mainly controlled by the interplay of fault frictional properties, effective normal stress, and the elastic stiffness of the surrounding material.
许多实验室地震模拟通过物理粘滑实验和数值模拟研究了快慢滑事件的机理。最近的观测结果表明,快滑和慢滑模式主要受断层摩擦特性、等效法向应力和周围材料弹性刚度的相互作用控制。
The velocity dependence of the frictional rate parameter and critical slip distance also play an important role in the mode of slip. However, why fast earthquakes and slow earthquakes would occur in the same fault is still difficult to understand.
Fast and slow earthquakes may obey different scaling laws, and this scaling behavior demonstrates that fast and slow earthquakes can be thought of as different manifestations of the same fault motion phenomena, which would indicate that these slow earthquakes are governed by fundamentally different mechanisms than fast earthquakes. The stick–slip experiments of granular materials have been carried out, there has never been a synchronous ultrahigh speed acquisition experiment.
摩擦速率参数和临界滑移距离的速度依赖性对滑移模式也起着重要作用。然而,为什么在同一断层中会发生快震和慢震,这一点仍然难以理解。
快地震和慢地震可能遵循不同的尺度规律,这种尺度行为表明,快地震和慢地震可以被视为同一断层运动现象的不同表现形式,这将表明这些慢地震与快地震受根本不同的机制支配。颗粒材料的粘滑实验已经开展过,但从未有过同步超高速采集实验。
Due to sampling rate limitations, it is difficult to capture the high-resolution granular fault thickness variation process of fast-slip and slow-slip events and analyze their detailed physical mechanisms. In previous laboratory studies, it was observed that granular fault compacts during fast-slip events and dilates during the stick process.
Instead, the granular fault dilates during the fast-slip events were observed by one laboratory experiment and molecular dynamics simulations. It is still a puzzle about whether the sample thickness is dilated or compacted during the fast slips, and there is basically no conclusion on the mechanism of slow slips.
由于采样率的限制,很难捕捉到快滑和慢滑事件中高分辨率的颗粒断层厚度变化过程,也很难分析其详细的物理机制。在以往的实验室研究中,人们观察到颗粒状断层在快速滑动过程中会压实,而在粘滞过程中会扩张。
而通过一次实验室实验和分子动力学模拟观察到,在快速滑动过程中,粒状断层会扩张。样品厚度在快速滑动过程中是扩张还是压实仍是一个难题,慢速滑动的机理基本上还没有定论。
A general physical mechanism of fast and slow slip modes remains enigmatic. Stress changes due to the earthquake slip, both dynamic and static, have long been thought to cause dilatancy in the fault zone that recovers (compaction) after the earthquake. The dilation of the fault zone during co-seismic slip in the 2019 Ridgecrest earthquakes has been directly observed by analyzing co-seismic strain tensors.
快速和慢速滑移模式的一般物理机制仍然是个谜。长期以来,人们一直认为地震滑动引起的应力变化(包括动态和静态应力变化)会导致断层带扩张,并在震后恢复(压实)。通过分析共震应变张量,可以直接观察到 2019 年 Ridgecrest 地震共震滑动过程中断层带的扩张。
Previously, this type of dilatancy had only been inferred through post-seismic analysis. High temporal resolution is critical for capturing the coseismic slip rupture of faults. Moreover, in laboratory experiments, it is necessary to use a high temporal resolution acquisition system to monitor the stick–slip dynamic process, which may provide insight into the dynamic slip mechanism of earthquakes.
在此之前,这种类型的膨胀只能通过震后分析来推断。高时间分辨率对于捕捉断层的共震滑动破裂至关重要。此外,在实验室实验中,有必要使用高时间分辨率采集系统来监测粘滑动态过程,这可能有助于深入了解地震的动态滑动机制。
The concept of force chains has been used in explanations of the mechanical properties of granular materials. Fault gouge is composed of granular packings, and the stick–slip of granular packings is related to the formation and destruction of force chain.
Under the shear load, the granular assemblies are anisotropic, and the force chain is not uniform in space, forming force chains with different strengths. The failure modes of different force chain networks may control the stick–slip behavior of granular assemblies. In stick–slip instability, force chain buckling and reforming are associated with the shearing of the granular assemblies, which correspond to the storage and release of elastic strain energy.
力链的概念已被用于解释颗粒材料的力学特性。断层破碎带由颗粒集合体组成,颗粒集合体的粘滑与力链的形成和破坏相联系。
在剪切荷载作用下,颗粒集合体具有各向异性,力链在空间上并不均匀,会形成不同强度的力链。不同力链网络的破坏模式可能会控制颗粒集合体的粘滑行为。在粘滑不稳定性中,力链的屈曲和重新形成与颗粒集合体的剪切有关,相当于弹性应变能的存储和释放。
In the sheared granular assemblies, the collisions of grains cause abrupt perturbation of the force chain and release elastic strain energy. The released energy typically leads to the generation of elastic waves in the kHz frequency range, termed acoustic emission (AE). AE is now commonly used to indirectly detect microphysical events during the stick–slip behavior of granular assemblies. These AE events carry spectral information on physical behavior during shearing.
在剪切的颗粒集合体中,颗粒的碰撞会引起力链的突然扰动,并释放出弹性应变能。释放的能量通常会在千赫频率范围内产生弹性波,称为声发射(AE)。目前,声发射通常用于间接检测颗粒集合体粘滑行为过程中的微物理事件。这些声发射事件包含剪切过程中物理行为的频谱信息。
Some studies suggest that the burst of AEs may be generated by the collision between grains. The relationship between AEs and different slip modes is rarely noticed. Due to the lack of synchronous ultrahigh sampling rate acquisition for shear stress (SS), AE, and sample thickness variation during stick–slip, the mechanism of fast and slow slip events is still unclear. Meanwhile, the low-resolution time sequence results could not explain the detailed granular fault thickness variation and physical scenarios during slips.
一些研究表明,AE 们的爆发可能是由颗粒间的碰撞产生的。AE 与不同滑移模式之间的关系很少被注意到。由于缺乏对粘滑过程中剪应力(SS)、AE 和样品厚度变化的同步超高采样率采集,快速和慢速滑动事件的机理仍不清楚。同时,低分辨率时序结果无法解释滑动过程中详细的颗粒断层厚度变化和物理图像。
Here, we used a synchronous ultrahigh speed (10 MHz sampling rate) acquisition system to record SS, AE, and sample thickness variation during stick–slip in a ring shear apparatus. We carried out statistical analysis of these slip event types and refined analysis of AEs, SS, and sample thickness synchronously.
在此,我们使用同步超高速(10 MHz 采样率)采集系统记录了环形剪切仪器中粘滑过程中的 SS、AE 和样品厚度变化。我们对这些滑动事件类型进行了统计分析,并同步完善了对 AE、SS 和样品厚度的分析。
These are discussed in the context of the physical mechanisms and slip failure processes. Moreover, the synchronous ultrahigh speed acquisition system allows us to directly measure phenomena such as the precise thickness variation process that previously were only observed as compaction or dilation at low temporal resolution (seconds time scale) during fast slip. The sampling rate in these studies ranges from 1 kHz to 1 MHz.
我们将结合物理机制和滑移破坏过程对这些问题进行讨论。此外,同步超高速采集系统使我们能够直接测量精确的厚度变化过程等现象,而这些现象以前只能在快速滑移过程中以较低的时间分辨率(秒时间尺度)观察到压实或扩张现象。这些研究的采样率范围为 $1\text{ kHz}$ 至 $1\text{ MHz}$。
Nevertheless, there is rarely synchronous time series analysis of SS drop and sample thickness variation with high time resolution (millisecond time scale). Fast slip events are characterized by somewhat intricate variation of the sample thickness: A short compaction pulse during the rapid release of stress is followed by dilation and vibrations of the sample’s thickness.
Using accurate displacement monitoring, we observed dilation during the slow-slip event. These fast and slow slip events with the dilation process have similar dilatancy characteristics to natural fault slip events, which would shed light on the underlying mechanisms of both catastrophic fast earthquakes and slow earthquakes.
然而,很少有高时间分辨率(毫秒级)的同步时间序列分析 SS 下降和样品厚度变化。快速滑移事件的特点是样品厚度的复杂变化:在快速释放应力的过程中会产生一个短暂的压实脉冲,随后样本厚度会发生扩张和振动。
通过精确的位移监测,我们观察到了慢速滑移事件中的扩张现象。这些带有扩张过程的快速和慢速滑动事件与自然断层滑动事件具有相似的扩张特性,这将揭示灾难性快速地震和慢速地震的内在机制。
Results
Characteristics of Laboratory Stick–Slip Events.
Fig. 1A depicts the variation of SS in uniform-size (0.8 to 1 mm) glass sphere ring shear tests (Materials and Methods), conducted at four different normal stresses (900 kPa, 1100 kPa, 1300 kPa, 1500 kPa), with respect to shear duration. Many drops in SS characterize the curves. Stick–slip events are observed under all four normal stress conditions and show normal-stress dependence. One representative stick–slip cycle with fast-slip and slow-slip events under the condition of 1,500 kPa is illustrated in Fig. 1B. Points A and B represent the start and the cessation of the stress drop in the fast- slip event. Points C and D represent the start and the cessation of the stress drop in the slow-slip event.
图 1A 描述了在四种不同法向应力(900 kPa、1100 kPa、1300 kPa 和 1500 kPa)下进行的均匀尺寸(0.8 至 1 毫米)玻璃球环形剪切试验(材料和方法)中 SS 随剪切持续时间的变化情况。在这些曲线中,有许多 SS 下降的特征。在所有四种法向应力条件下都能观察到粘滑现象,并显示出与法向应力的相关性。图 1B 展示了在 1,500 kPa 条件下一个具有代表性的粘滑循环,其中包括快滑和慢滑事件。A 点和 B 点代表快速滑移事件中应力下降的开始点和停止点。C 点和 D 点代表慢滑事件中应力下降的开始点和停止点。
Three phases of the stick–slip process (Fig. 1B) can be recognized in the results: fast slip (phase I A-B), stick (phase II B-C), and slow slip (phase III C-D). A fast and large stress drop (average stress decrease rate of 6,081.45 kPa/s) occurred in phase I, accompanied by a large-amplitude AE (>30 mV) (Fig. 1C). At this temporal resolution (8,000 ms), we observe the dilation of the sample thickness in the fast slip process and slow compaction (hundreds of milliseconds) of the sample thickness after the fast stress drop (Fig. 1D). After the fast slip (phase I A-B), the stick phase II was initiated (Fig. 1B). The stick process corresponded to a gradual increase in SS in the granular assemblies with the accumulation of elastic strain energy.
从结果中可以看出棒状滑移过程的三个阶段(图 1B):快速滑移(阶段 I A-B)、粘 (阶段 II B-C)和慢速滑移(阶段 III C-D)。在第一阶段出现了快速而巨大的应力下降(平均应力下降率为 6,081.45 kPa/s),并伴有大振幅 AE(>30 mV)(图 1C)。在此时间分辨率(8,000 毫秒)下,我们观察到样品厚度在快速滑移过程中的扩张,以及样品厚度在快速应力下降后的缓慢压实(数百毫秒)(图 1D)。在快速滑移(第一阶段 A-B)之后,开始进入第二阶段(图 1B)。粘滞过程与颗粒组合体中 SS 的逐渐增加以及弹性应变能的积累相对应。
Moreover, in the progression of the stick phase, we observed slow and small releases of SS (average stress decrease rate of 35.61 kPa/s) (Fig. 1B) accompanied by intermittent releases of AEs (Fig. 1C), defined as the slow slip (phase III C-D), with only a dilation (Fig. 1D) during this process. Then, the granular assemblies enter the next stick phase, continuing to accumulate elastic strain energy until the next slip event occurs (Fig. 1B).
此外,在粘连阶段的进展过程中,我们观察到 SS(平均应力下降速率为 35.61 kPa/s)缓慢而少量地释放(图 1B),同时伴随着 AE 的间歇性释放(图 1C),这被定义为缓慢滑移(阶段 III C-D),在此过程中仅有扩张(图 1D)。然后,颗粒集合体进入下一个粘滞阶段,继续积累弹性应变能,直到发生下一次滑移事件(图 1B)。
We plot the fast-slip event (A-B) and slow-slip event (C-D) in Fig. 1B into the same time window (600 ms) and compare the difference between the two modes of slip events (Fig. 1 E and H). It can be observed that the slip duration of the fast-slip event (~15 ms) is shorter than that of the slow-slip event (~300 ms). In the fast-slip event, the granular assemblies release an AE event with a large amplitude (>30 mV) (Fig. 1F). During the 600 ms temporal resolution, at the beginning of the stress drop at point A (Fig. 1E), the sample thickness experienced dilation followed by vibration (Fig. 1G), the vibration persisted after the stress drop ceased at point B (Fig. 1E) and continued until the slow compaction of the sample thickness began (Fig. 1G).
我们将图 1B 中的快速滑动事件(A-B)和慢速滑动事件(C-D)绘制到相同的时间窗口(600 毫秒)中,并比较两种滑动事件模式之间的差异(图 1 E 和 H)。可以看出,快速滑动事件的滑动持续时间(约 15 毫秒)比慢速滑动事件的滑动持续时间(约 300 毫秒)短。在快速滑动事件中,颗粒组件释放出振幅较大(>30 mV)的 AE 事件(图 1F)。在 600 毫秒的时间分辨率内,在 A 点应力下降开始时(图 1E),样品厚度经历了扩张,随后是振动(图 1G),在 B 点应力下降停止后,振动持续存在(图 1E),直到样品厚度开始缓慢压实(图 1G)。
However, at a higher temporal resolution (45 ms), we observed a short compaction pulse (~2 ms) as the stress began to decrease (Fig. 2C). In the slow-slip event, we observed that the granular assemblies intermittently release several AEs bursts with smaller amplitudes (<30 mV) (Fig. 1I) during slow stress drop (C-D in Fig. 1H); we also observed a dilation in the slow-slip process (Fig. 1J).
Similar mechanical behaviors of the stick–slip cycle were observed under all of the different normal stress conditions (SI Appendix, Figs. S1 and S2). However, it should be noted that there were also many slow-slip events during the stick process (SI Appendix, Fig. S1). Fast-slip events are usually followed by an alternating sequence of stick and slow-slip intervals.
然而,在更高的时间分辨率(45 毫秒)下,我们观察到应力开始下降时出现了一个短的压实脉冲(约 2 毫秒)(图 2C)。在慢速滑动事件中,我们观察到颗粒集合体在缓慢应力下降过程中(图 1H 中的 C-D)间歇性地释放出几个振幅较小(<30 mV)的 AE 脉冲串(图 1I);我们还观察到慢速滑动过程中的扩张现象(图 1J)。
在所有不同的正常应力条件下,都观察到了类似的粘滑循环机械行为(SI 附录,图 S1 和 S2)。不过,需要注意的是,在粘连过程中也出现了许多慢速滑动事件(SI 附录,图 S1)。快速滑动事件之后通常会交替出现粘连和慢速滑动间隔。
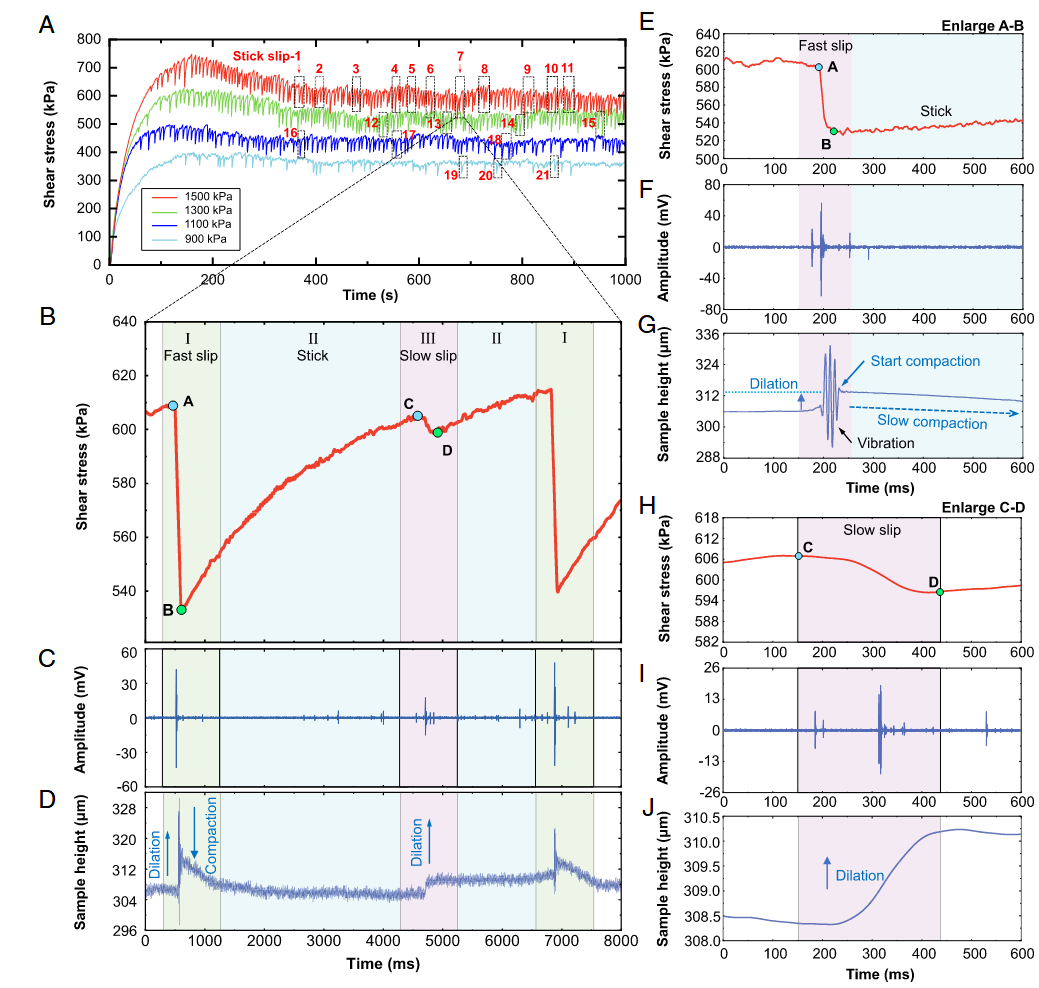
Measured data in uniform-size glass sphere ring shear experiment with a selected representative stick–slip cycle. (A) SS as a function of shear duration. Selection of stick–slip events marked by red numbers. (B–D) Detail of simultaneous measurement SS, AE waveform, and SH for two slip events at 1,500 kPa (selected stick slip-7 in Fig. 1A). Data reveal three phases during the stick–slip process: fast slip (phase I) from A (start of stress drop in fast slip) to B (cessation of stress drop in fast slip), stick (phase II) from B to C, and slow slip (phase III) from C (start of stress drop in slow slip) to D (cessation of stress drop in slow slip). The color blocks in the figures only roughly indicate the scope of the three phases; the three phases are demarcated by letters A, B, C, and D. Increase in SH upward represents sample thickness dilation. At this temporal resolution (8,000 ms), the dilation of the sample thickness and the slow compaction during the fast-slip event were illustrated in Fig. 1D, while only the dilation of the sample thickness was observed during the slow-slip event. (E–G) Details of the fast-slip event in Fig. 1B, at this temporal resolution (600 ms), the sample thickness dilation, vibration, and slow compaction were observed in Fig. 1G. (H–J) Details of the slow-slip event in Fig. 1B; the red curve is the SS after average smoothing of the purple raw data. The dilation of the sample thickness was observed in Fig. 1J.
均匀尺寸玻璃球环形剪切实验中的测量数据,并选取了具有代表性的粘滑循环。 (A) SS 与剪切持续时间的函数关系。红色数字标示的部分粘滑事件。 (B-D)在 1,500 kPa 下同时测量 SS、AE 波形和 SH 的细节(图 1A 中选择了粘滑-7)。数据显示了粘滑过程中的三个阶段:从 A(快速滑移中应力下降开始)到 B(快速滑移中应力下降停止)的快速滑移(I 阶段)、从 B 到 C 的粘滑(II 阶段)和从 C(慢速滑移中应力下降开始)到 D(慢速滑移中应力下降停止)的慢速滑移(III 阶段)。图中的色块仅粗略显示了三个阶段的范围;三个阶段以字母 A、B、C 和 D 划分。在这种时间分辨率(8,000 毫秒)下,图 1D 显示了快速滑动事件中样本厚度的扩张和缓慢的压实,而在慢速滑动事件中只观察到样本厚度的扩张。 (E-G)图 1B 中快速滑动事件的细节,在此时间分辨率(600 毫秒)下,观察到图 1G 中样品厚度扩张、振动和缓慢压实。 (H-J)图 1B 中慢速滑动事件的细节;红色曲线是对紫色原始数据进行平均平滑处理后的 SS。图 1J 中观察到样本厚度的扩张。
High Time-Resolved Analysis of the Fast-Slip Event
For high time-resolved analysis of the fast-slip event, we increased the temporal resolution to 45 ms. The fast-slip event sequences of SS, AE waveform, sample height (SH), and AE spectrum in the time domain (45 ms) are shown in Fig. 2. We observed obvious AEs signals during the time series A-B (Fig. 2 A and B), which indicates that the granular assemblies slip rapidly during the time series A-B. Thus, the SS decreased from A to B was defined as the total stress drop in the fast-slip event. As shown in Fig. 2A, the total stress drop ($\tau_{A}-\tau_{B}$) across the fast-slip event was 75.41 kPa, and the slip duration ($t_{B}-t_{A}$) was 12.40 ms. A close look reveals a transition point (T point) during stress drop (Fig. 2A), which indicates that there are two stress drop processes (A-T and T-B) in the fast-slip event.
为了对快速滑动事件进行高时间分辨率分析,我们将时间分辨率提高到 45 毫秒。图 2 显示了时域(45 毫秒)中的 SS、AE 波形、采样高度(SH)和 AE 频谱的快速滑动事件序列。在时间序列 A-B 中,我们观察到了明显的 AEs 信号(图 2 A 和 B),这表明颗粒组件在时间序列 A-B 中快速滑动。因此,从 A 到 B 的 SS 下降值被定义为快速滑动事件中的总应力下降值。如图 2A 所示,整个快速滑动事件的总应力降($\tau_{A}-\tau_{B}$)为 $75.41\text{ kPa}$,滑动持续时间($t_{B}-t_{A}$)为 $12.40\text{ ms}$。仔细观察可以发现在应力下降过程中有一个过渡点(T 点)(图 2A),这表明在快速滑移事件中有两个应力下降过程(A-T 和 T-B)。
The fast-slip event started with a large stress drop process (A-T) (average stress decrease rate of 28.14 kPa/ms), which released large SS (63.04 kPa) in a very short time (2.24 ms). When the stress reached the transition point in Fig. 2A, we noticed a minor stress drop process (T-B) with an average stress decrease rate of 1.21 kPa/ms. During this process, the SS slightly strengthened and then gradually decreased until reaching point B. This minor stress drop process lasted for 10.16 ms and resulted in a smaller stress drop of 12.37 kPa (Fig. 2A). Then, the sheared granular assemblies entered stick phase II, and the elastic strain energy accumulated in the shearing process (Fig. 1B).
快速滑动事件以一个较大的应力下降过程(A-T)(平均应力下降率为 $28.14\text{ kPa/ms}$)开始,在很短的时间内($2.24\text{ ms}$)释放出较大的 SS($63.04\text{ kPa}$)。当应力达到图 2A 中的过渡点时,我们注意到一个轻微的应力下降过程(T-B),平均应力下降率为 $1.21\text{ kPa/ms}$。在这一过程中,SS 稍微增强,然后逐渐减弱,直至到达 B 点。这一微小的应力下降过程持续了 $10.16$ 毫秒,应力下降幅度较小,为 $12.37$ 千帕(图 2A)。随后,受剪切的颗粒集合体进入粘滞阶段 II,弹性应变能在剪切过程中不断积累(图 1B)。
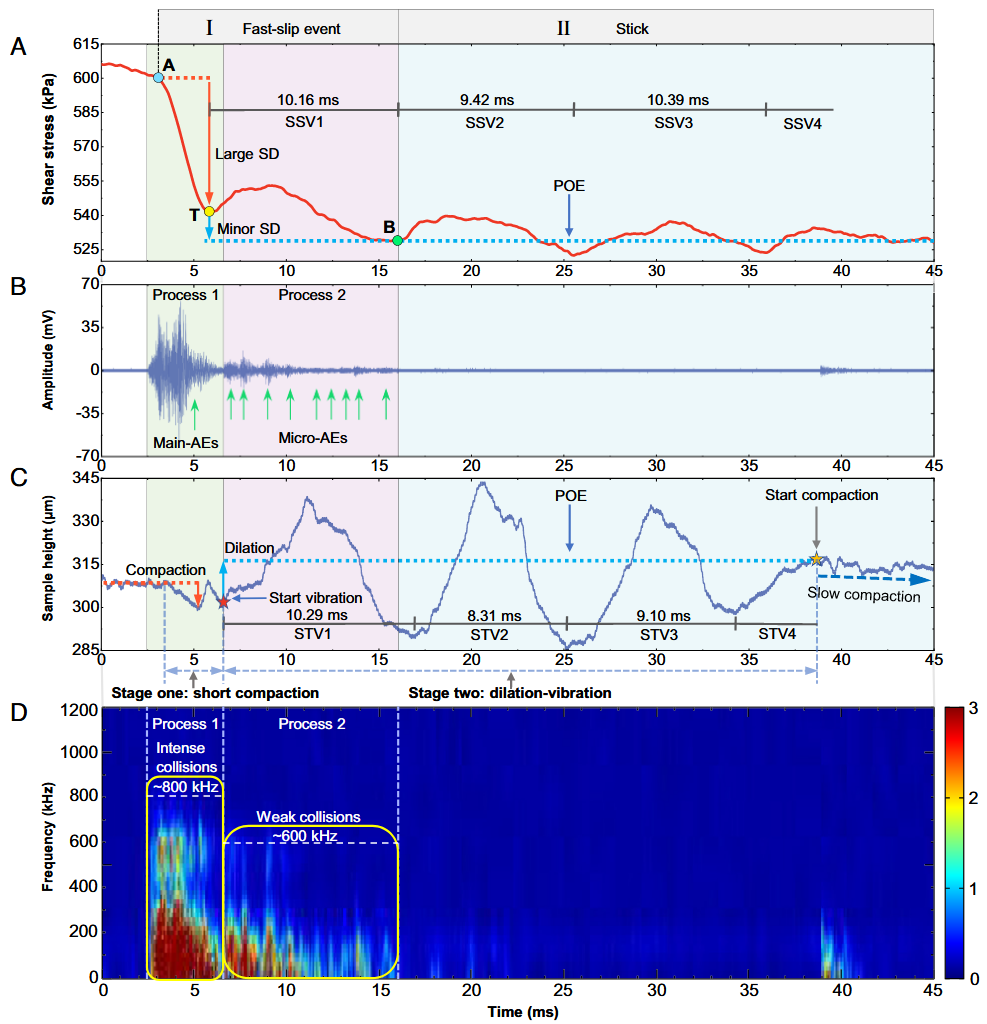
The selected result of the fast-slip event in Fig. 1E depicts the event sequences of SS, AE waveform, SH, and spectrum of AE in the time domain (45 ms). (A) Variations in SS with time in 45 ms (Fast slip); the red curve is the SS after smoothing of the raw data. The SS from A to T is released rapidly. The SS from T to B is released slowly while vibrating. The SS enters the stick phase after point B. The red dotted line indicates the SS before stress drop. The blue dotted line indicates the SS after dilation and POE. Large SD is the large stress drop process, minor SD is the minor stress drop process, and SSV is the SS vibration. (B) Two processes of AEs excitation in the fast-slip event: process 1 from the start of main-AEs to cessation of main-AEs and process 2 from the cessation of main-AEs to B (cessation of stress drop). Micro-AEs are released in process 2. (C) Variations in SH with time in 45 ms; the red pentagon represents the starting of vibration in sample thickness. The red dotted line indicates the SH before compaction. The blue dotted line indicates the SH after dilation and POE. The yellow pentagon represents the starting of slow compaction in sample thickness. STV is the sample thickness vibration. (D) The spectrum of AEs in the time domain. In process 1, the frequency bandwidths have high-frequency spectrum (~800 kHz). In process 2, the frequency bandwidths consist of lower frequency AE spectrum (<600 kHz).
图 1E 中快速滑动事件的选定结果描述了 SS、AE 波形、SH 和 AE 频谱在时域(45 毫秒)上的事件序列。 (A) $45$ 毫秒内 SS 随时间的变化(快速滑移);红色曲线为原始数据平滑后的 SS。从 A 到 T 的 SS 快速释放。从 T 到 B 的 SS 在振动时缓慢释放。红色虚线表示应力下降前的 SS。蓝色虚线表示扩张和 POE 后的 SS。大 SD 表示大应力下降过程,小 SD 表示小应力下降过程,SSV 表示 SS 振动。 (B) 快速滑动事件中 AEs 激发的两个过程:过程 1 从主-AEs 开始到主-AEs 停止,过程 2 从主-AEs 停止到 B(应力下降停止)。微 AE 在过程 2 中释放。 (C) $45$ 毫秒内 SH 随时间的变化;红色五边形代表样品厚度的振动起始点。红色虚线表示压实前的 SH。蓝色虚线表示扩张和 POE 后的 SH。黄色五边形表示样品厚度开始缓慢压实。STV 是样品厚度振动。
As shown in Fig. 2 A and C, there are mainly two stages during the fast slip process: short compaction and dilation–vibration; we captured the SS and SH vibrated around the position of equilibrium (POE) with the help of the ultrahigh speed acquisition system. After the initial large stress drop from A to T, the first SS vibration (SSV1) occurs and gradually releases the minor stress drop.
This is followed by SSV2, SSV3, and SSV4 (Fig. 2A), we noticed that the vibrations gradually attenuate and come to a stop during SSV4. The distance from the granular assemblies to the unguided LVDT (linear variable differential transformer) sensor is different from that of the torque sensor (SI Appendix, Fig. S11A), and the elastic wave propagates from the source to the unguided LVDT sensor farther.
如图 2 A 和 C 所示,快速滑移过程主要分为两个阶段:短时压实和扩张振动;在超高速采集系统的帮助下,我们捕捉到了 SS 和 SH 在平衡位置(POE)附近的振动。在从 A 到 T 的初始大应力下降之后,会发生第一次 SS 振动(SSV1),并逐渐释放小应力下降。
随后是 SSV2、SSV3 和 SSV4(图 2A),我们注意到在 SSV4 期间振动逐渐减弱并停止。颗粒集合体到非制导 LVDT(线性可变差分变压器)传感器的距离与扭矩传感器不同(SI 附录,图 S11A),弹性波从振动源传播到非制导 LVDT 传感器的距离更远。
Thus, we observed a phase difference between the SS vibration and the sample thickness vibration: The onset of the first sample thickness vibration (STV1) lags behind the beginning of the SSV1 (point T in Fig. 2A). The thickness of the sample dilates at the start of STV1 (Fig. 2C), and subsequently experiences four vibration events: STV1, STV2, STV3, and STV4, we noticed that the vibrations gradually attenuate and come to a stop during STV4.
因此,我们观察到 SS 振动和样品厚度振动之间存在相位差:第一次样品厚度振动(STV1)的开始时间滞后于 SSV1 的开始时间(图 2A 中的 T 点)。样品厚度在 STV1 开始时扩张(图 2C),随后经历四次振动事件:我们注意到振动逐渐减弱,并在 STV4 期间停止。
Upon the cessation of the sample thickness vibration, the slow compaction of sample thickness initiates (Figs. 1G and 2C). Although the vibration of SS is not completely synchronized with the vibration of sample thickness, the average periods of these two kinds of vibrations are 9.99 ms and 9.23 ms, respectively, indicating that the two kinds of vibrations are approximate synchronous vibrations.
样品厚度振动停止后,样品厚度开始缓慢压实(图 1G 和 2C)。虽然 SS 的振动与样品厚度的振动并不完全同步,但这两种振动的平均周期分别为 $9.99$ 毫秒和 $9.23$ 毫秒,表明这两种振动是近似同步振动。
The time sequence of the fast-slip event between SS and AE is illustrated in Fig. 2 A and B. It can be seen that AEs commence prior to the stress drop, which is consistent with previous studies. We distinguish two primary categories (Fig. 2B) in fast slip progression based on the AEs: process 1 from the start of main-AEs to the cessation of main-AEs and process 2, which follows the cessation of main-AEs to point B (cessation of stress drop).
图 2 A 和 B 展示了 SS 和 AE 之间快速滑移事件的时间序列。可以看出,AE 开始于应力下降之前,这与之前的研究一致。我们根据 AE 将快速滑移过程分为两个主要类别(图 2B):从主 AE 开始到主 AE 停止的过程 1 和主 AE 停止后到 B 点(应力下降停止)的过程 2。
The distinction between the two processes is based on the AE amplitude during fast slip progression. We observed that the maximum AE amplitude (~60 mV) was generated in process 1, and this process was accompanied by compaction of sample thickness (Fig. 2C) and large stress drop (Fig. 2A). After the main-AE in process 1 is released (Fig. 2B), process 2 begins and micro-AEs are observed. However, the amplitudes of these micro-AEs are smaller compared to the main-AEs in process 1. Synchronous acquisition results revealed that the minor stress drop (Fig. 2A) and the sample thickness dilation (Fig. 2C) occur in process 2, accompanied by the occurrence of SSV1 and STV1.
这两个过程的区别基于快速滑移过程中的 AE 振幅。我们观察到,最大 AE 振幅(约 $60\text{ mV}$)产生于过程 1,该过程伴随着样品厚度的压实(图 2C)和较大的应力下降(图 2A)。过程 1 中的主-AE 释放后(图 2B),过程 2 开始并观察到微-AE。然而,与过程 1 中的主-AE 相比,这些微-AE 的振幅较小。同步采集结果显示,伴随着 SSV1 和 STV1 的出现,微小应力下降(图 2A)和样品厚度扩张(图 2C)发生在过程 2 中。
We employed the short-time Fourier Transform to obtain the AE Time–Frequency spectrum, two distinct groups of AE frequencies in theTime-Frequency spectrum were observed in Fig. 2D: the first group consisted of large-amplitude AEs with a high-frequency spectrum of around 800 kHz, which were mainly released during process 1. The second group consisted of small-amplitude AEs with a lower frequency spectrum of less than 600 kHz, which were observed during process 2 (Fig. 2 B and D).
我们利用短时傅里叶变换获得了 AE 时频谱,在图 2D 中观察到时频谱中有两组不同的 AE 频率:第一组由大振幅 AE 组成,其高频谱在 $800\text{ kHz}$ 左右,主要在过程 1 中释放。第二组由振幅较小的 AE 组成,其频谱较低,低于 $600\text{ kHz}$,在过程 2 中观察到(图 2 B 和 D)。
The frequency of the SS vibration and sample thickness vibration was about 100 Hz, far less than the kHz frequency range, indicating that these vibration events occurred in the whole granular assemblies rather than the vibration between grains. Further repeatable synchronous acquisition results of the fast-slip events in 18 ms windows under different normal stresses are illustrated in SI Appendix, Figs. S3 and S4.
SS 振动和样品厚度振动的频率约为 $100\text{ Hz}$,远小于 $\text{kHz}$ 频率范围,表明这些振动事件发生在整个颗粒聚集体中,而不是颗粒之间的振动。不同法向应力下 $18\text{ ms}$ 窗口内快速滑动事件的进一步可重复同步采集结果见 SI 附录图 S3 和 S4。
High Time-Resolved Analysis of Slow-Slip Event
The slow-slip event sequences of SS, AE waveform, SH, and AE spectrum in the time domain (400 ms) are shown in Fig. 3. As shown in Fig. 3A, the slow slip process had a small stress drop ($\tau_{C}-\tau_{D}$ $10.17\text{ kPa}$) and long slip duration (tD-tC 285.55 ms).
The slow-slip event differed from the fast-slip event, in having no AE signal at the beginning of the stress drop. The high-resolution synchronous analysis of the time sequence shows that the onset of AE lagged behind the slow stress drop (Fig. 3 A and B), and intermittent AEs burst release was observed in the process of slow stress drop.
图 3 显示了时域(400 毫秒)中的 SS、AE 波形, SH 和 AE 频谱的缓慢滑移事件序列。如图 3A 所示,慢滑移过程的应力下降较小($\tau_{C}-\tau_{D}$ $10.17\text{ kPa}$),滑移持续时间较长($t_{D}-t_{C}$ $285.55\text{ ms}$)。
慢滑动事件与快滑动事件不同,在应力下降开始时没有 AE 信号。对时间序列的高分辨率同步分析表明,AE 的开始滞后于慢应力下降(图 3 A 和 B),在慢应力下降过程中观察到间歇性的 AEs 爆发释放。
Moreover, the amplitude of AEs in the slow slip process (Fig. 3B) was smaller than that of main-AEs in the fast-slip event (Fig. 2B). It should be noted that sample thickness dilation initiated during the stress drop process rather than at the stress drop starting point C (Fig. 3 A and C). The AE spectrum in the slow slip process was shown in Fig. 3D. We zoom into time windows of 5 ms to analyze each AE (AE 1-12) during the slow slip process, and three AE signals were observed: AE-1, AE-3, and AE-4, which show high frequency-spectrum reaching ~600 kHz, while other signals have lower frequencies (<300 kHz) (SI Appendix, Fig. S5).
此外,慢滑移过程中的 AEs 振幅(图 3B)小于快速滑移过程中的主 AEs 振幅(图 2B)。值得注意的是,试样厚度扩张是在应力下降过程中开始的,而不是在应力下降起点 C 开始的(图 3 A 和 C)。图 3D 显示了缓慢滑移过程中的 AE 频谱。我们放大 5 毫秒的时间窗口来分析缓慢滑移过程中的每个 AE(AE 1-12),共观察到三个 AE 信号:AE-1、AE-3 和 AE-4 显示出高频谱,频率达到约 $600\text{ kHz}$,而其他信号频率较低($<300\text{ kHz}$)(SI 附录,图 S5)。
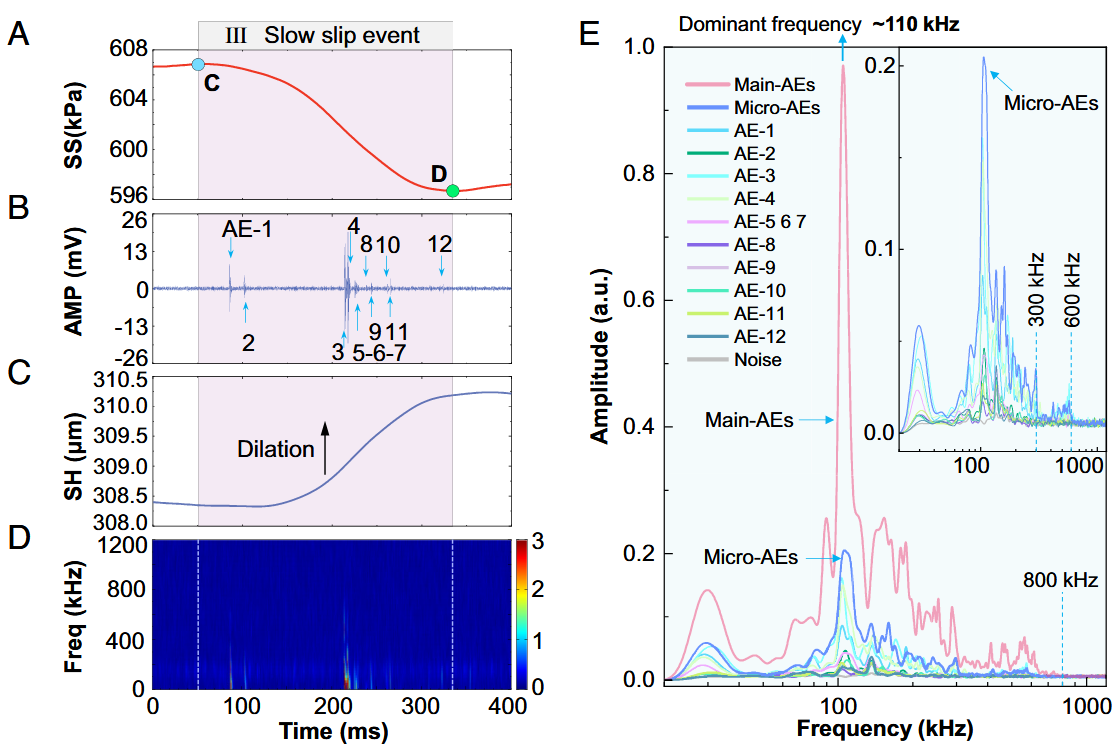
The selected result of the slow-slip event in Fig. 1H depicts the event sequences of SS, AE waveform, SH, and spectrum of AEs in the time domain (400 ms). (A) Variations in SS with time in 400 ms (slow slip); the red curve is the SS after smoothing of the raw data. (B) During the slow stress drop process, there was a delay between the onset of AEs and the gradual decrease in stress. Intermittent AEs, labeled as AE 1-12, were observed during this period of slow stress drop, amplitude (AMP). (C) The sample’s thickness dilation is initiated in the stress drop process; the blue curve is the SS after smoothing of the raw data, SH. (D) The spectrum of AEs in the time domain, frequency (Freq). (E) The marginal spectrum (amplitude vs. frequency) in a specific time window of 8 ms. The main-AEs and micro-AEs were taken from the fast slip event in Fig. 2B, and AEs 1-12 were taken from the slow slip event in Fig. 3B. The insert shows the enlargement of the signals in the amplitude range of 0 to 0.2.
图 1H 所选的慢速滑动事件结果描述了 SS、AE 波形、SH 和 AE 频谱在时域(400 毫秒)上的事件序列。 (A) $400$ 毫秒(慢滑)内 SS 随时间的变化;红色曲线为原始数据平滑后的 SS。 (B) 在应力缓慢下降过程中,AE 开始与应力逐渐下降之间存在延迟。在应力缓慢下降期间,观察到间歇性 AE(AE 1-12),振幅(AMP)。 (C) 样品的厚度扩张是在应力下降过程中开始的;蓝色曲线是对原始数据 SH 进行平滑处理后的 SS。 (D) AE 的时域频谱,频率 (Freq)。 (E) $8$ 毫秒特定时间窗内的边际频谱(振幅与频率)。主 AE 和微 AE 取自图 2B 中的快滑移事件,AE 1-12 取自图 3B 中的慢速滑移事件。插页显示了振幅范围为 $0$ 至 $0.2$ 的放大信号。
We compared the power spectrum of fast and slow slips quantitatively by plotting the marginal spectrum (amplitude vs. frequency) in a specific time window of 8 ms (Fig. 3E). The background noise signal is at the lowest end and can be basically ignored. Main-AEs and micro-AEs were taken from the fast slip event in Fig. 2B, and AEs 1-12 were taken from the slow slip event in Fig. 3B. These AE signals from fast and slow slips have similar frequency-amplitude profiles, and the dominant frequency is around 110 kHz.
我们通过绘制 8 毫秒特定时间窗口内的边际谱(振幅与频率),定量比较了快速和慢速滑动的功率谱(图 3E)。背景噪声信号处于最低端,基本上可以忽略。主 AE 和微 AE 取自图 2B 中的快滑移事件,AE 1-12 取自图 3B 中的慢滑移事件。这些来自快和慢滑移的 AE 信号具有相似的频率-振幅曲线,主频在 110 kHz 左右。
The amplitude of the main-AEs is the highest, and the cutoff frequency reaches ~$800\text{ kHz}$. The amplitude of the micro-AEs is smaller; the cutoff frequency reaches ~$600\text{ kHz}$. As shown in the insert of Fig. 3E, we zoom into the signals in the amplitude range of $0$ to $0.2$. The signal amplitude during the slow slip process is smaller than micro-AEs, some cutoff frequencies reach ~600 kHz, and most of them are only below 300 kHz.
主-AEs 的振幅最大,截止频率达到 ~$800\text{ kHz}$。微 AE 的振幅较小,截止频率达到 ~$600\text{kHz}$。如图 3E 插入图所示,我们放大了振幅范围在 $0$ 至 $0.2$ 之间的信号。慢滑移过程中的信号振幅比微 AE 小,部分截止频率达到 ~ $600\text{ kHz}$,大部分仅低于 $300\text{ kHz}$。
Statistical Properties of Fast-Slip and Slow-Slip Events
An advantage of our system was that the ultrahigh sampling rate signals could be used to compare the full-time variation of fast-slip and slow-slip events. In order to better display the statistical results of the two slip events under different normal stresses, we normalized the SS variation rate and slip duration, respectively.
We present a collapse of different slip events in which the SS variation rate $(\mathrm{d}\text{SS}/\mathrm{d}t)$ (the slope of SS curves for fast-slip events and slow- slip events), normalized by the maximum SS variation rate of each event $(\mathrm{d}\text{SS}/\mathrm{d}t)\text{max}$, and the slip time t of the fast-slip events and slow-slip events, normalized by the slip duration, are plotted (Fig. 4).
我们系统的优势在于,超高采样率信号可用于比较快滑移和慢滑移事件的全时变化。为了更好地显示不同法向应力下两种滑移事件的统计结果,我们分别对 SS 变化率和滑移持续时间进行了归一化处理。
These temporal avalanche profiles have a similar pattern under different normal stresses. In the fast-slip event (Fig. 4A), there is a significant decrease in stress during the large stress drop process (A-T in Figs. 2A and 4A). This process rapidly decreases the stress until it reaches a transition point (T point in Figs. 2A and 4A). After this transition point, there is a minor stress drop process (T-B) characterized by a small rise in stress, followed by a gradual and slight decrease in stress at a slower rate. The stress variation rate reaches a peak between A and T before the midpoint of the slip duration.
在不同的法向应力下,这些时间雪崩剖面具有相似的图案。在快滑动事件中(图 4A),应力在大幅应力下降过程(图 2A 和图 4A 中的 A-T)中显著下降。在这一过程中,应力迅速下降,直至达到一个过渡点(图 2A 和图 4A 中的 T 点)。过渡点之后是一个小的应力下降过程(T-B),其特点是应力小幅上升,随后应力以较慢的速度逐渐小幅下降。在滑移持续时间的中点之前,应力变化率在 A 和 T 之间达到峰值。
什么听君一席话, 如听一席话. 这写得有点搞笑了已经
In the process of slow slip, only one stress drop (C-D in Figs. 3A and 4B) was observed. The stress variation rate increased first and then decreased, and the stress drop rate reached its peak near the midpoint of slip duration The normalization factors of two axes are calculated by the $(\mathrm{d}\text{SS}/\mathrm{d}t)\text{max}$ and the duration of each slip events. In order to find out whether the normalization factors depend on the applied normal stress, we plot the normalization factors vs. normal stress in Fig. 4 C–F. Linear fitting found that $(\mathrm{d}\text{SS}/\mathrm{d}t)\text{max}$ has a strong linear correlation with normal stress ($R^{2}$ for fast and slow slip events are 0.98 and 0.99, respectively). The duration is independent of the normal stress.
在慢滑移过程中,只观察到一个应力降(图 3A 和图 4B 中的 C-D)。应力变化率先增大后减小,应力下降率在滑移持续时间的中点附近达到峰值。 两坐标轴的归一化系数是通过 $(\mathrm{d}\text{SS}/\mathrm{d}t)\text{max}$ 和每个滑移事件的持续时间计算得出的。为了弄清归一化系数是否取决于所施加的法向应力,我们在图 4 C-F 中绘制了归一化系数与法向应力的关系图。线性拟合发现,$(\mathrm{d}\text{SS}/\mathrm{d}t)\text{max}$ 与法向应力有很强的线性相关(快和慢滑移事件的 $R^{2}$ 分别为 $0.98$ 和 $0.99$)。持续时间与法向应力无关。
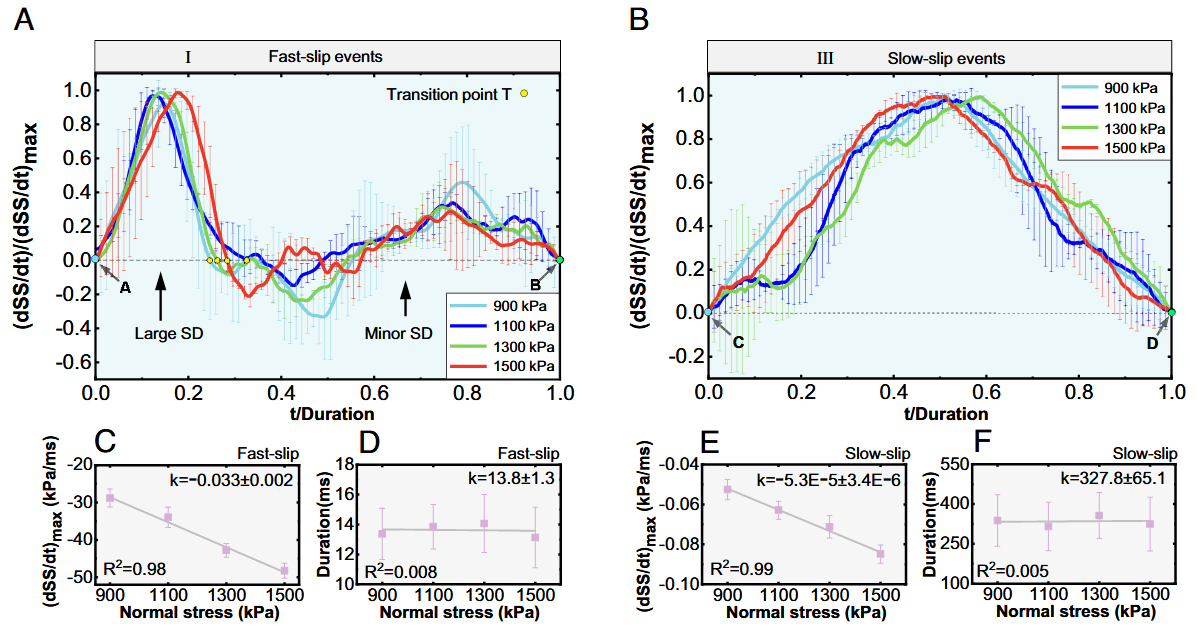
Temporal avalanche profiles and linear fitting of normalization factors and normal stress of fast-slip and slow-slip events in uniform size tests. (A) SS variation rate normalized by the maximum SS variation rate of the fast-slip events at four normal stresses. Profiles are averaged over the whole slip duration. Error bars are calculated as the SEM. Above the dotted line is the stress drop, otherwise the stress rise. Large SD (large stress drop process), minor SD (minor stress drop process). Points A and B represent the start and the cessation of the stress drop in the fast-slip event. The appearance time of the T point in the process of stress drop under different normal stresses is different. (B) SS variation rate normalized by the maximum SS variation rate of the slow-slip events at four normal stresses. Profiles are averaged over the whole slip duration. Error bars are calculated as the SEM. Above the dotted line is the stress drop, otherwise the stress rise. Points C and D represent the start and the cessation of the stress drop in the slow-slip event. (C) The linear fitting result of the maximum SS variation rate and applied normal stress in fast-slip. (D) The linear fitting result of the slip duration and applied normal stress in fast-slip. (E) The linear fitting result of the maximum SS variation rate and applied normal stress in slow-slip. (F) The linear fitting result of the slip duration and applied normal stress in slow-slip. In the linear fitting, $R^{2}$ is the coefficient of determination, $k$ is the slope, and error bars are calculated as the SEM.
均匀尺寸试验中快滑和慢滑事件的时间雪崩剖面以及归一化系数和法向应力的线性拟合。 (A) 以四种法向应力下快速滑移事件的最大 SS 变化率归一化的 SS 变化率。曲线是整个滑移持续时间的平均值。误差带以 SEM 计算。虚线以上为应力下降,否则为应力上升。大SD(大应力下降过程),小 SD(小应力下降过程)。A 点和 B 点分别代表快滑动事件中应力下降的起始点和终止点。不同法向应力下应力下降过程中 T 点的出现时间不同。 (B) 以四种法向应力下的慢滑动事件的最大 SS 变化率归一化的 SS 变化率。曲线是整个滑动持续时间的平均值。误差带以 SEM 计算。虚线以上为应力下降,否则为应力上升。C 点和 D 点分别代表缓滑动事件中应力下降的起始点和终止点。 (C) 快滑动时最大 SS 变化率与施加法向应力的线性拟合结果。 (D) 快速滑移时滑移持续时间与外加法向应力的线性拟合结果。 (E) 慢滑动时最大 SS 变化率与施加法向应力的线性拟合结果。 (F) 慢滑动时滑移持续时间与外加法向应力的线性拟合结果。在线性拟合中,$R^{2}$ 是确定系数,$k$ 是斜率,误差带以 SEM 计算。
Fast and slow slip events could be quantitatively distinguished by stress drop and slip duration. The fast-slip events and slow-slip events under different normal stress conditions were statistically analyzed.
The scatter plot in double logarithmic coordinates is shown in Fig. 5A. The stress drop caused by the fast-slip event in the laboratory earthquake is one order of magnitude higher than that of the slow-slip event. The duration of the fast-slip event is one order of magnitude smaller than that of the slow-slip event. The fast slip duration is about $10$ to $20$ ms, manifested as a rapid release of elastic strain energy.
快速和慢速滑移事件可通过应力下降和滑移持续时间进行定量区分。对不同法向应力条件下的快滑事件和慢滑事件进行了统计分析。
双对数坐标散点图如图 5A 所示。实验室地震中快滑事件引起的应力下降比慢滑事件强一个数量级。快滑事件的持续时间比慢滑事件小一个数量级。快滑动持续时间约为 $10$ 至 $20$ 毫秒,表现为弹性应变能的快速释放。
The duration of the slow slip process fluctuates within 200 to 700 ms, which corresponds to the slow release of stress. In order to explore the relationship between the two types of slip duration and the stress drop under different normal stress conditions, we made a cumulative density function (CDF) for the slip duration and the stress drop of the two types of events. The CDF can be written as Eq. $\eqref{eq1}$:
$$ F(a) = P(x\leq a),\tag{1}\label{eq1} $$
where $F(a)$ is the CDF, and $P(x\leq a)$ is the sum of the probability of all values less than or equal to $a$.
慢速滑移过程的持续时间在 $200$ 到 $700$ 毫秒内波动,与应力的缓慢释放相对应。为了探究不同法向应力条件下两种滑移持续时间和应力下降之间的关系,我们对两种事件的滑移持续时间和应力下降做了一个累积密度函数(CDF)。该 CDF 可写成公式 $\eqref{eq1}$:
$$ F(a) = P(x\leq a) $$
其中 $F(a)$ 是 CDF,$P(x\leq a)$ 是所有小于或等于 $a$ 的值的概率之和。
We plotted them on the double logarithmic coordinate diagram (Fig. 5 B and C). The slip duration has a similar distribution interval under different normal stress conditions, indicating that the duration of the two types of events is independent of the magnitude of the normal stress (in the normal stress range we are investigating). In the process of both fast and slow slip, the magnitude of the stress drop positively correlates with the magnitude of the normal stress.
我们将它们绘制在双对数坐标图上(图 5 B 和 C)。在不同的法向应力条件下,滑移持续时间具有相似的分布区间,这表明两类事件的持续时间与法向应力大小无关(在我们研究的法向应力范围内)。在快速和慢速滑移过程中,应力下降的幅度与法向应力的幅度呈正相关。
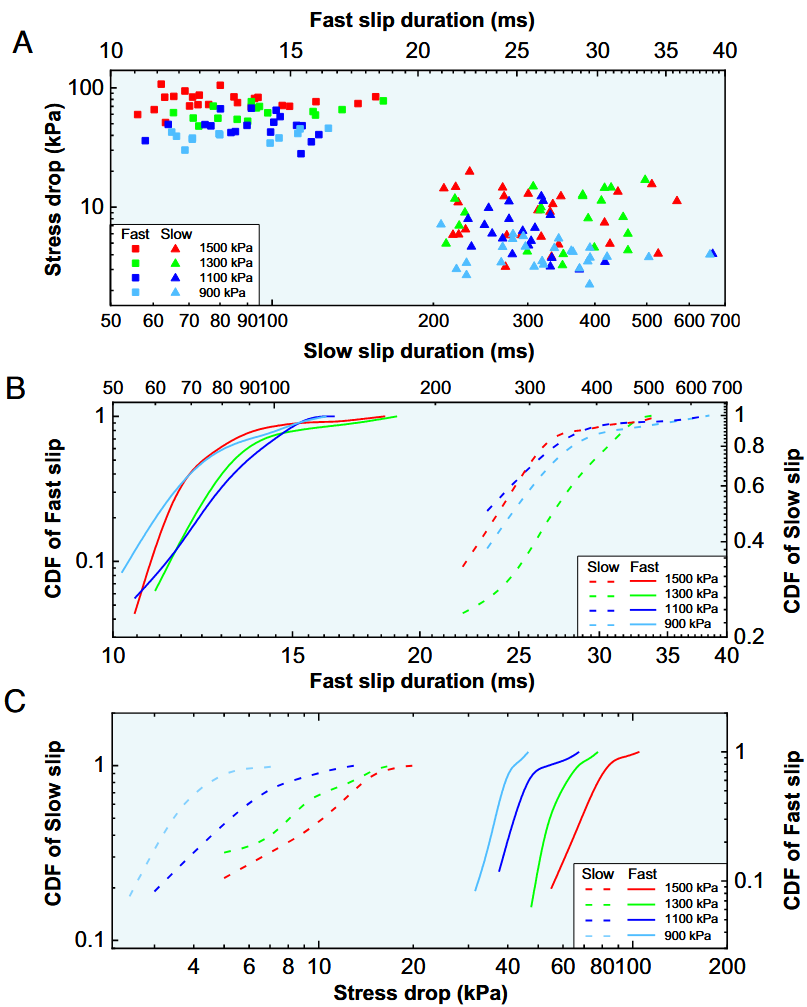
Stress drop and slip duration of two slip events in uniform size tests. (A) Stress drop versus slip duration for fast-slip and slow-slip events. The fast-slip events are shorter in duration than the slow-slip events, and the stress drop of fast-slip events is larger than the slow-slip events. (B) The CDF of slip duration in fast-slip events and slow-slip events. The fast-slip events are shorter in duration than the slow-slip events. The slip duration is independent of the magnitude of the normal stress (C) The CDF of stress drops in fast-slip events and slow-slip events. The stress drop of fast-slip events is larger than the slow-slip events. The magnitude of the stress drop positively correlates with the magnitude of the normal stress.
均匀尺寸试验中两次滑移事件的应力下降和滑移持续时间。 (A) 快速滑动和慢速滑动事件的应力下降与滑动持续时间的关系。快滑事件的持续时间比慢滑事件短,快滑事件的应力降比慢滑事件大。 (B) 快速滑动事件和慢速滑动事件中滑动持续时间的 CDF。快速滑移事件的持续时间短于慢速滑移事件。滑移持续时间与法向应力大小无关。 (C) 快速滑动事件和慢速滑动事件中应力下降的 CDF。快速滑动事件的应力下降大于慢速滑动事件。应力降的大小与法向应力的大小呈正相关。
We also conducted a set of the large particle size distribution (PSD) (0.2 to 2 mm) glass sphere ring shear tests under 1,500 kPa normal stress (SI Appendix, Figs. S6 and S7). Three phases of the stick–slip process were consistent with the uniform size tests (Fig. 1). We analyzed the large PSD glass sphere ring shear syn- chronous acquisition results of fast-slip events in 18 ms and slow-slip events in 600 ms (SI Appendix, Fig. S8) and observed the same characteristics as in the uniform size test.
我们还在 $1,500\text{ kPa}$ 法向应力下进行了一组大粒度分布(PSD)($0.2$ 至 $2$ 毫米)玻璃球环剪试验(SI 附录,图 S6 和 S7)。粘滑过程的三个阶段与均匀尺寸试验一致(图 1)。我们分析了 $18$ 毫秒内快速滑动事件和 $600$ 毫秒内缓慢滑动事件的大 PSD 玻璃球环剪同步采集结果(SI 附录,图 S8),观察到与均匀尺寸试验相同的特征。
Discussion
The Transient Dilation during the Fast-Slip
There is still a significant debate over whether the sample thickness is dilated or compacted during fast slip. In recent studies, the measurements were interpreted in the following manner: During the slip event, the reduction of the SS is accompanied by compaction, whereas in between the slip events, the system recovers by dilation. This is somewhat surprising as this contrasts the classical view which associates slip with dilation in compact samples. However, Cain et al. argue that the dilation was similar in magnitude to the signal noise level, limiting the conclusions that could be drawn from the measurement.
关于样品厚度在快滑移过程中是扩张还是压实,目前仍有很大争议。在最近的研究中,对测量结果的解释如下:在滑移过程中,SS 的减少伴随着压实,而在滑移事件之间,系统通过扩张恢复。这有点令人吃惊,因为这与传统观点形成了鲜明对比,传统观点认为在致密样品中滑移与扩张有关。不过,Cain 等人认为,扩张的程度与信号噪声水平相近,限制了从测量中得出的结论。
We note that recent publications have used spring-returned LVDT to record thickness changes during slip and only observed a compaction process. However, the classic view used a separated LVDT (unguided LVDT) with a low sampling rate of 1 kHz. Our observation used an unguided LVDT sensor and increased the sampling rate to 10 MHz. The dynamic response of the spring-returned LVDT (~10 Hz) is much lower than the unguided LVDT (2 kHz).
我们注意到,最近发表的文章使用弹簧回位 LVDT 记录滑移过程中的厚度变化,但只观察到压实过程。然而,经典观点使用的是采样率低至 $1\text{ kHz}$ 的分离式 LVDT(非制导 LVDT)。我们的观测使用了非制导 LVDT 传感器,并将采样率提高到 $10\text{ MHz}$。弹簧复位 LVDT 的动态响应(约 $10\text{ Hz}$)远低于无制导 LVDT($2\text{ kHz}$)。
For comparison, we added a spring- returned LVDT in the ring shear apparatus; the sample thickness variation during the fast-slip was synchronously recorded with $10\text{ MHz}$ acquisition rate by using unguided LVDT and spring- returned LVDT (Fig. 6).
Before the stress drop, the system recovers by dilation. The transient dilation process during the fast-slip recorded by unguided LVDT is associated with stress reduction; then, we observed the compaction takes place (Fig. 6 A and B). The transient dilation process during the fast-slip was not observed by using spring-returned LVDT.
为了进行比较,我们在环形剪切装置中增加了一个弹簧回位 LVDT;通过使用无导向 LVDT 和弹簧回位 LVDT,以 $10\text{ MHz}$ 的采集速率同步记录了快速滑动过程中的样品厚度变化(图 6)。
在应力下降之前,系统通过扩张恢复。无导向 LVDT 记录的快速滑动过程中的瞬态扩张过程与应力降低有关;随后,我们观察到压实发生(图 6 A 和 B)。使用弹簧复位 LVDT 则无法观察到快速滑动过程中的瞬态扩张过程。
We only observed a compaction process associated with stress reduction, which lasted longer than the stress reduction (Fig. 6C). The transient dilation process was also not observed by using the spring-returned LVDT in recent studies, and these studies observed that compaction was associated with the slip.
In fact, in our observation and recent studies, the compaction events observed by using the spring-returned LVDT were associated with stress reduction. However, our observation of compaction lasted longer than the stress reduction; we think that this compaction may be a phenomenon, which is in agreement with that observed in the field: Fault compaction occurs after the earthquake.
我们只观察到与应力减小相关的压实过程,其持续时间长于应力减小(图 6C)。在最近的研究中,使用弹簧复位 LVDT 也没有观察到瞬态扩张过程,这些研究观察到压实与滑移有关。
事实上,根据我们的观察和最近的研究,使用弹簧复位 LVDT 观察到的压实事件与应力降低有关。但是,我们观察到的压实持续时间比应力减小的持续时间长;我们认为这种压实可能是一种现象,这与现场观察到的一致:断层压实发生在地震之后。
The use of the unguided LVDT is the root cause of observing the transient dilation. This study provides more insight into unresolved puzzles about sample compaction or dilation during slip. The results of this study indicate that the sample is in dilation during slip, followed by compaction. This phenomenon is consistent with what is observed in the field: the fault zone experiences dilation during the slip event and compaction after the earthquake.
使用非制导 LVDT 是观察到瞬时扩张的根本原因。这项研究为滑移过程中样品压实或扩张的未解之谜提供了更多见解。研究结果表明,样品在滑移过程中处于扩张状态,随后被压实。这一现象与实地观察到的情况一致:断层带在滑动过程中发生扩张,地震后发生压实。
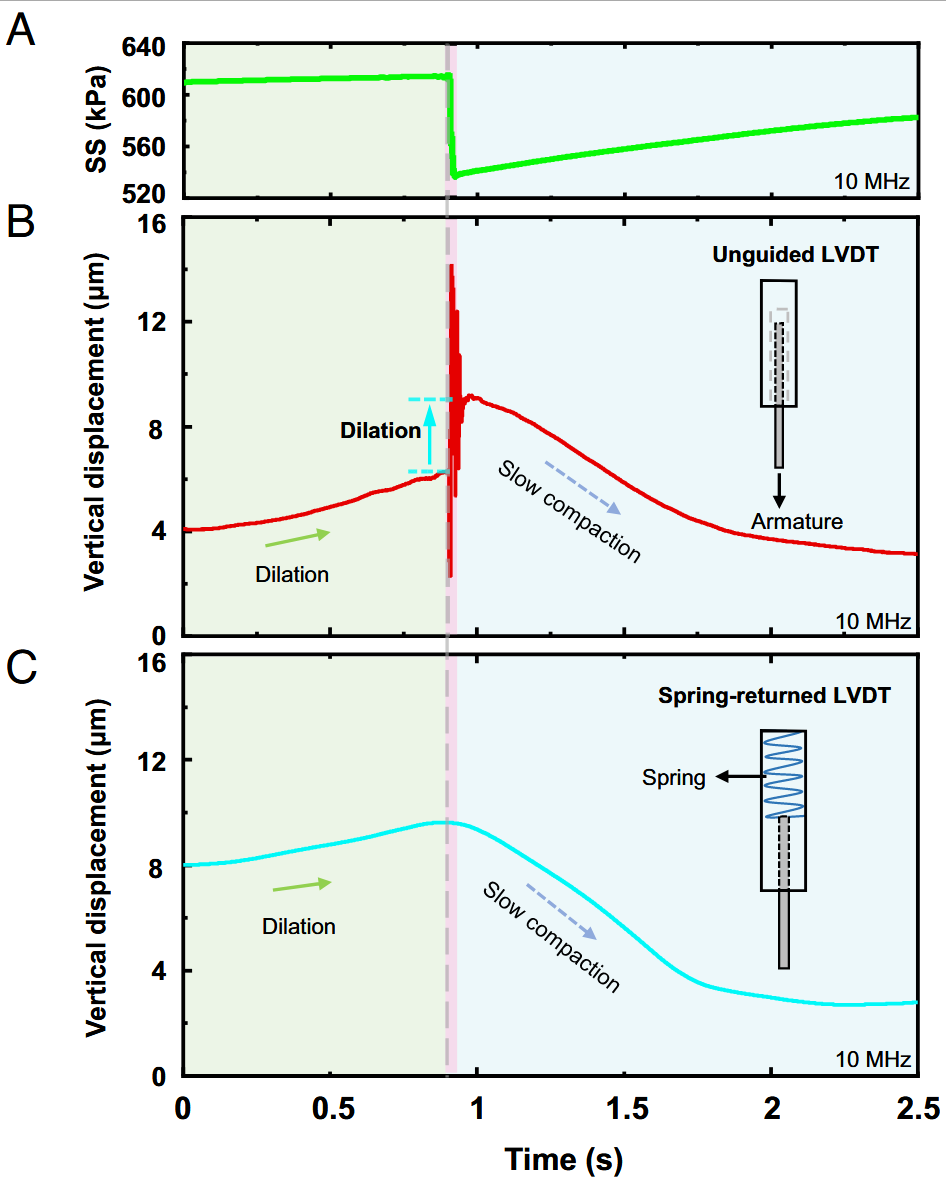
The unguided LVDT recorded more detailed layer thickness variation information than the spring-returned LVDT. (A) Stress drop during the fast- slip. SS. The light red area marks the slip process. (B) In the case of unguided LVDT, instantaneous dilation during the stress drop was recorded (red block), while the slow compaction occurred after the stress drop. (C) In the case of spring-returned LVDT, the instantaneous dilation during the stress drop was not recorded; only slow compaction was observed.
无导向 LVDT 比弹簧回位 LVDT 记录了更详细的层厚度变化信息。 (A) 快速滑移过程中的应力下降。SS.浅红色区域标志着滑移过程。 (B) 在无制导 LVDT 的情况下,记录了应力下降过程中的瞬时扩张(红色块),而缓慢的压实发生在应力下降之后。 (C) 在弹簧复位 LVDT 的情况下,没有记录应力下降过程中的瞬时扩张;只观察到缓慢的压实。
理解为键盘的键轴即可
The AE Characteristics of Free-Drop Collision Test
We conducted free-drop collision tests with different drop-off heights to explore the AE spectrum and waveform characteristics during the collision process (Fig. 7 A and B); see SI Appendix for the full discussion.
As shown in Fig. 7B, the AE waveform of the free-drop collision test (drop-off height 40 mm) is characterized by a clear AE burst, and the cutoff frequency reaches ~650 KHz. The cutoff frequency and amplitude of the AE burst generated by the collision at different drop-off heights (5, 10, 20, 30, 40, and 90 mm) are positively correlated with the collision velocity (SI Appendix, Fig. S9).
We compared the power spectrum of different free-drop collision tests quantitatively by plotting the marginal spectrum in a specific time window of 8 ms (Fig. 7C).
我们进行了不同落差高度的自由落体碰撞试验,以探索碰撞过程中的 AE 频谱和波形特征(图 7 A 和 B);详细讨论见 SI 附录。
如图 7B 所示,自由落体碰撞试验(落体高度为 40 毫米)的 AE 波形具有明显的 AE 爆发特征,截止频率达到 ~$650\text{ KHz}$。不同落差高度($5$、$10$、$20$、$30$、$40$ 和 $90$ 毫米)碰撞产生的 AE 爆的截止频率和振幅与碰撞速度呈正相关(SI 附录,图 S9)。
我们通过绘制 8 毫秒特定时间窗口内的边际谱,定量比较了不同自由落体碰撞试验的功率谱(图 7C)。
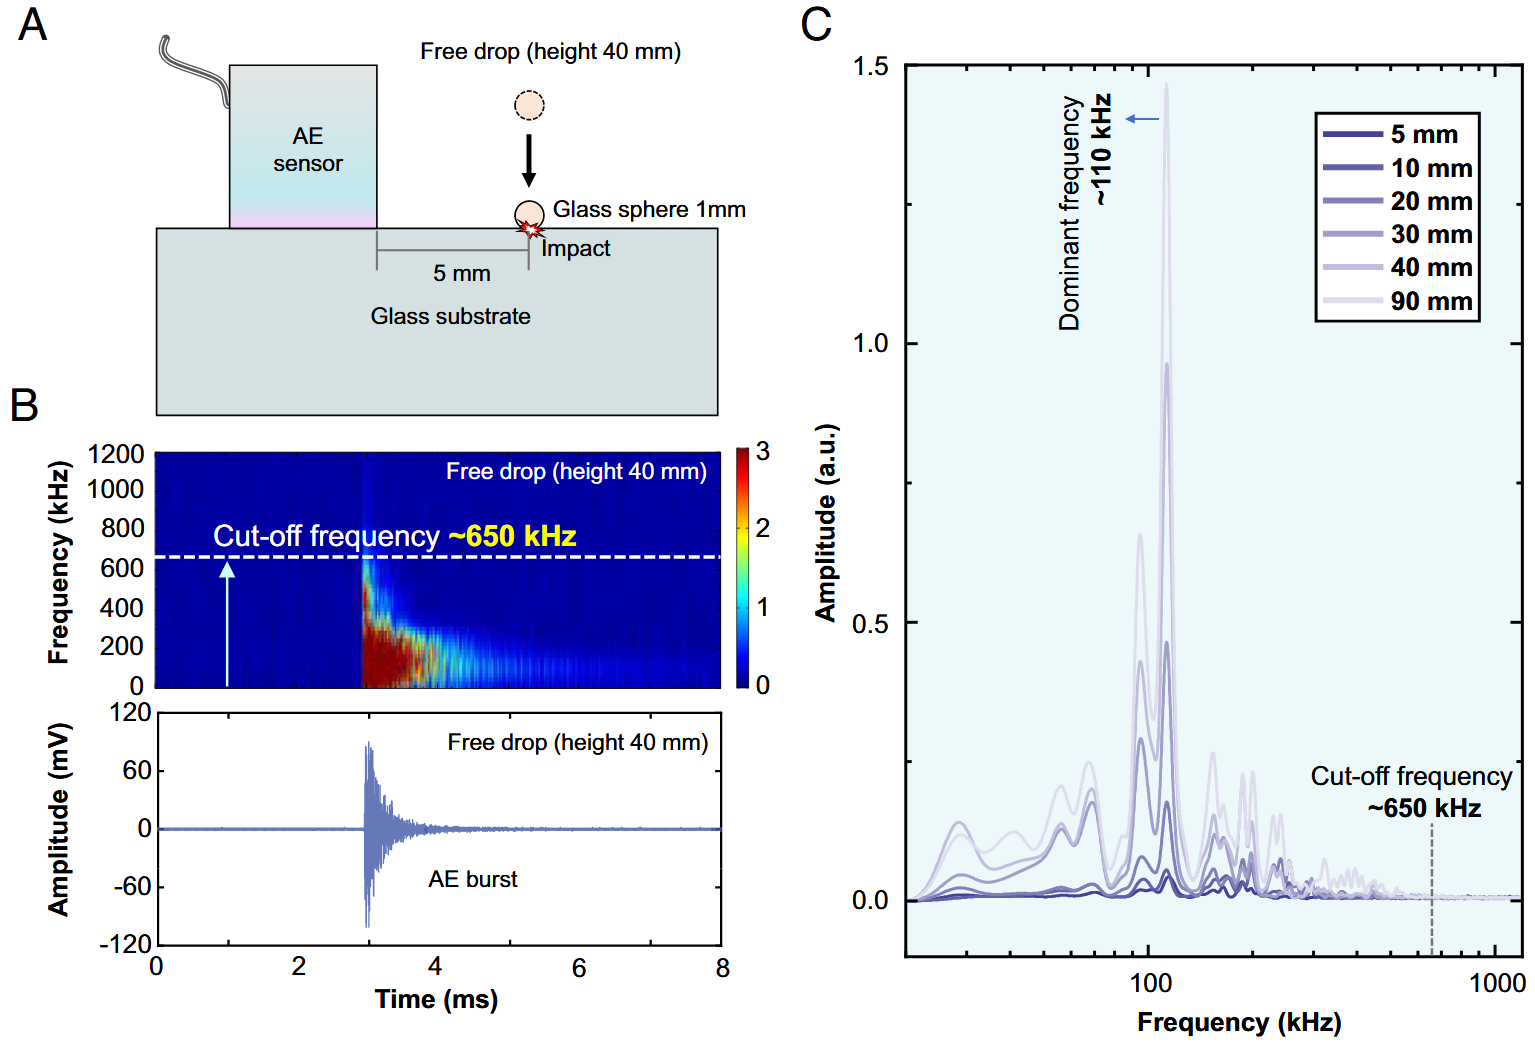
Device drawing and experimental results of free drop collision test. (A) Free drop collision test with 1-mm glass sphere, drop-off height 40 mm. (B) The AE spectrum and waveform of the collision test. (C) The marginal spectrum of all the free drop collision tests with different drop-off heights in a specific time window of 8 ms.
装置图和自由落体碰撞试验的实验结果。 (A) $1$ 毫米玻璃球自由落体碰撞试验,落体高度 $40$ 毫米。 (B) 碰撞试验的 AE 频谱和波形。 (C) 在 $8$ 毫秒的特定时间窗口内,不同落差高度的所有自由落体碰撞试验的边际谱。
As the drop-off height increases, the amplitude and cutoff frequency are increasing. The dominant frequency of these AE signals is about 110 kHz, which is consistent with the AE signals during the fast and slow slip events (Fig. 3E). The observed AEs during fast and slow slip show similar AE characteristics with the free-drop test. Thus, we can semiquantitatively judge the collision intensity inside the granular assembly according to the cutoff frequency and amplitude of the AE burst. As shown in Fig. 3E, the main-AEs in the fast slip reach about 800 kHz for intense collision, and the micro-AEs in the fast slip reach about 600 kHz for weak collision. Some AEs in the slow slip reach about 600 kHz, and most of the other AEs are below 300 kHz, indicating that these intermittent collisions have different intensities.
随着落差高度的增加,振幅和截止频率也在增加。这些 AE 信号的主频约为 $110\text{ kHz}$,与快速和慢速滑移过程中的 AE 信号一致(图 3E)。在快速和慢速滑移过程中观察到的 AE 与自由落体试验的 AE 特性相似。因此,我们可以根据 AE 爆发的截止频率和振幅来半定量地判断颗粒聚集体内部的碰撞强度。如图 3E 所示,在强烈碰撞时,快速滑移中的主 AE 达到约 $800\text{ kHz}$,在微弱碰撞时,快速滑移中的微 AE 达到约 $600\text{ kHz}$。慢滑移中的一些 AE 达到约 $600\text{ kHz}$,而其他大多数 AE 低于 $300\text{ kHz}$,这表明这些间歇碰撞具有不同的强度。
The Mechanism of the Fast-Slip Event
Spatial heterogeneity of contact forces between grains varies during the shear process. As the SS is applied, the force chain network exhibits an anisotropic nature. The force chain network structures can be classified into three groups based on the magnitude of the contact force between the grains: a strong force chain network that carries stress balancing paths, a weak force chain network that bears less stress, and a loose granular structure are least stressed.
在剪切过程中,颗粒间接触力的空间异质性会发生变化。随着 SS 的施加,力链网络呈现出各向异性。根据颗粒间接触力的大小,力链网络结构可分为三类:承载应力平衡路径的强力链网络、承受应力较小的弱力链网络和应力最小的松散颗粒结构。
The strong force chain collapse induces the intense grain collision, and the weak force chain collapse induces the weak grain collision. As shown in Fig. 3E, the largest amplitude AE is the main-AEs in the fast slip; thus, we speculated that the strong force chain collapse is responsible for the fast slip.
强力链坍塌诱发强烈的颗粒碰撞,弱力链坍塌诱发微弱的颗粒碰撞。如图 3E 所示,在快速滑移中,振幅最大的 AE 是主 AE,因此我们推测快速滑移是由强力链坍塌引起的。
In the stick phase (Fig. 1B), the strong force chains accumulate elastic strain energy with the shearing process. We observed that the onset of main-AEs preceded the fast stress drop (Fig. 2 A and B); thus, we speculate that there are some local grains that slip prior to overall force chain failure and may trigger the fast slip process. There are mainly two stages during the fast slip process: short compaction and dilation–vibration (Figs. 2C and 6B). We make a hypothesis of physical mechanism about the short compaction and dilation–vibration.
在粘滞阶段(图 1B),强力链在剪切过程中积累了弹性应变能。我们观察到,主-AEs 的出现先于快速应力下降(图 2 A 和 B);因此,我们推测,在整个力链破坏之前,有一些局部颗粒发生了滑移,可能触发了快速滑移过程。快速滑移过程主要分为两个阶段:短时压实和扩张振动(图 2C 和 6B)。我们对短压实和扩张振动的物理机制进行了假设。
Compaction or dilation is dependent on the packing state of the sample. Before the fast slip, the sample is comparatively loose due to the dilation (Fig. 6 B and C). In stage one, once the SS of one or two strong force chains exceeds the shear strength of the contact grains, the strong force chains fail, which leads to elastic strain energy rapidly releasing (the large stress drop A-T in Fig. 2A).
压实或扩张取决于样品的堆积状态。在快速滑移之前,样品由于膨胀而相对松散(图 6 B 和 C)。在第一阶段,一旦一个或两个强力链的 SS 超过接触颗粒的剪切强度,强力链就会破坏,从而导致弹性应变能迅速释放(图 2A 中的大应力降 A-T)。
The grains with high kinetic energy impact the surrounding grains, exciting a large-amplitude AE (main-AEs in Fig. 2B) with high-frequency bandwidth(Fig. 2D). The collision between grains presents a mechanical impulse imparted on the granular structure, which precipitates a cascade of chain failures of the force chain network. The chain failures lead to granular assembly collapses, so a short compaction pulse was observed during the rapid release of stress (Figs. 2C and 6B).
具有高动能的颗粒撞击周围的颗粒,激发出具有大频带宽的大振幅 AE(图 2B 中的主 AE)(图 2D)。颗粒间的碰撞会对颗粒结构产生机械冲力,从而引发一连串的力链网络连锁破坏。链式破坏会导致颗粒结构坍塌,因此在应力快速释放期间会出现一个短暂的压实脉冲(图 2C 和 6B)。
In stage two (Figs. 2C and 6B), after a short compaction, the granular system became dense. After the grain collision caused by the force chain collapse, the grains continue to slide and cause dilation of the sample. Meanwhile, the strong grain collisions cause the vibration of the granular sample.
在第二阶段(图 2C 和 6B),经过短暂的压实后,颗粒体系变得致密。在力链崩塌引起的颗粒碰撞后,晶粒继续滑动并导致样品扩张。同时,强烈的颗粒碰撞会引起颗粒样品的振动。
We also observed the approximate synchronous vibrations of SS and sample thickness (Fig. 2 A and C) during the minor stress drop process (T-B in Fig. 2A); we think that the mechanical impulse caused by grain collisions continues to vibrate the granular assemblies, resulting in the approximate synchronous vibrations of the SS and the sample thickness. Upon the cessation of the layer vibration (Figs. 1G, 2C, and 6B), the grains recontact to accumulate elastic strain energy and adjust the structure of granular assemblies, resulting in slow compaction of layer thickness (Figs. 1G, 2C, and 6B) and rearrangement of the force chain network structures.
在小应力下降过程中(图 2A 中的 T-B),我们还观察到 SS 和样品厚度近似同步振动(图 2 A 和 C);我们认为颗粒碰撞产生的机械冲量持续振动颗粒集合体,导致 SS 和样品厚度近似同步振动。在层振动停止后(图 1G、2C 和 6B),颗粒重新接触以积累弹性应变能,并调整颗粒集合体的结构,从而导致层厚度的缓慢压实(图 1G、2C 和 6B)和力链网络结构的重新排列。
The Mechanism of Slow-Slip Event
The fast earthquakes are responsible for catastrophic ground vibration, but the slow earthquake may last for several months and will not cause catastrophic ground vibration. The AE signal with clear burst suggests collision of the grains. As shown in Fig. 3, during the slow slip, the small-amplitude AE signal is intermittent with clear burst, and the grain collision intensity is much weaker than that of the fast slip. The weak force chain collapse induces the weak grain collision.
快速地震会造成灾难性的地面振动,但慢速地震可能会持续数月,不会造成灾难性的地面振动。具有明显爆裂的 AE 信号表明存在颗粒碰撞。如图 3 所示,在慢速滑移过程中,小振幅 AE 信号是间歇性的,并伴有明显的爆发,颗粒碰撞强度比快速滑移时要弱得多。弱力链坍塌诱发了微弱的颗粒碰撞。
Thus, we speculated that the weak force chain collapse is responsible for the slow slip. Both fast and slow slips in granular assemblies exhibit dilatancy, which may be caused by the collapse of strong force chains in the former and weak force chains in the latter. Despite the differences in force chain strength, the physical processes involved in fast and slow slips are similar. During the slow stress drop, only dilation was observed (Fig. 3C). Moreover, in the triaxial compression experiments, it is also observed that the slow decrease of SS is accompanied by the slow volume dilation.
因此,我们推测弱力链坍缩是造成缓慢滑移的原因。颗粒集合体中的快速和慢速滑移都表现出扩张性,这可能是前者的强力链和后者的弱力链崩塌造成的。尽管力链强度不同,但快速和慢速滑移所涉及的物理过程是相似的。在缓慢应力下降过程中,只观察到扩张现象(图 3C)。此外,在三轴压缩实验中也观察到 SS 的缓慢下降伴随着缓慢的体积扩张。
During constant speed loading, the shear input power (rate of shear input work) is constant, and this energy is converted into plastic dilation deformation, which reduces the SS to maintain conservation of energy (Cam-clay model). Using X-ray computed tomography (CT) under triaxial compression, it was observed that the rearrangement of the force chain networks leads to the slow release of SS, and the grains rolling across the surrounding grains cause volume dilation.
在恒速加载过程中,剪切输入功率(剪切输入功速率)是恒定的,这种能量转化为塑性扩张变形,从而降低 SS 以保持能量守恒(Cam-clay 模型)。利用三轴压缩下的 X 射线计算机断层扫描(CT)观察到,力链网络的重新排列导致 SS 缓慢释放,颗粒在周围晶粒间滚动导致体积扩张。
Before the slow slip occurs, the thickness of the sample is relatively small (Fig. 1D), and the granular assembly is dense. When weak force chains fail and a slow slip occurs, the close-packed grains must seek new positions to accommodate the slip, leading to dilation in the thickness of the sample (Fig. 3C). The delay in the initiation of sample thickness dilation observed during the slow-slip event (Fig. 3 A and C) suggests that the release of elastic strain energy in the weak force chain occurs before the conversion from shear input work to plastic dilation deformation begins.
在发生缓慢滑移之前,样品的厚度相对较小(图 1D),颗粒组合致密。当弱力链失效并发生缓慢滑移时,紧密堆积的颗粒必须寻找新的位置以适应滑移,从而导致样品厚度扩张(图 3C)。在缓慢滑移过程中观察到的样品厚度扩张开始时间的延迟(图 3 A 和 C)表明,弱力链中弹性应变能的释放发生在剪切输入功转换为塑性扩张变形开始之前。
After the adjustment of the grains structure of the weak force chain, the bearing stress of the weak force chain reduced to lower level (slow stress drop in Fig. 3A). The grain collisions are very weak during the slow slip (Fig. 3E), and the mechanical impulse could not be excited to perturb the failure of strong chain; therefore, the failure of weak force chain will not lead to the overall failure of the granular assemblies.
弱力链的颗粒结构调整后,弱力链的承载应力降至较低水平(图 3A 中的慢应力下降)。在缓慢滑移过程中,颗粒碰撞非常微弱(图 3E),无法激发机械冲力来扰动强力链的失效,因此,弱力链的失效不会导致颗粒聚合体的整体破坏。
It was observed that the granular packings dilated slowly during the stick process (Fig. 6 B and C). This suggests that initially, force chains form and strengthen, and then the packings start to creep, leading to dilation. Once the dilation reaches an almost similar height, the fast-slip events begin.
Conceptually, this transition from stick to slip will therefore be functions of the granular layer thickness. We observe that slow slips with dilation accelerate the dilation progress during stick; therefore, the rearrangement of weak force chain during slow slips is more likely to lead to the fast slip.
据观察,颗粒堆积在粘连过程中扩张缓慢(图 6 B 和 C)。这表明,最初,力链形成并加强,然后填料开始蠕变,导致扩张。一旦扩张达到几乎相似的高度,快速滑动事件就开始了。
从概念上讲,从粘滞到滑移的转变将是颗粒层厚度的函数。我们观察到,带有扩张的慢速滑动会加速粘滞过程中的扩张进程;因此,慢速滑动过程中弱力链的重新排列更有可能导致快速滑动。
Implications for Fast and Slow Earthquake Slip Models
Coseismic strain tensors and postseismic analysis have confirmed that fault zones undergo dilation during coseismic slip and subsequently through compaction after the earthquake. In our synchronous ultrahigh speed acquisition stick–slip experiment, we found the similar variation process of the granular fault thickness as that of field earthquake. The granular assemblies dilated during the fast slip process, and even the vibration of the SS and SH was recorded.
共震应变张量和震后分析证实,断层带在共震滑动过程中会发生扩张,震后会发生压实。在同步超高速采集粘滑实验中,我们发现颗粒断层厚度的变化过程与实际地震相似。在快滑动过程中,颗粒集合体发生扩张,甚至记录到 SS 和 SH 的振动。
After the fast slip, the slow compaction (hundreds of milliseconds) was observed. Moreover, different from only coseismic dilation in the field, a very fast (~2 ms) compaction at the beginning of the fast slip in our experiment was observed (Fig. 2C). Although the glass spheres used in our experiment are simplified compared to real fault gouge, they are all granular materials and have the similar potential stick–slip mechanism. The results of this laboratory experiment are consistent with the field seismic observation, which shows that our observations have implications for the mechanism of real earthquakes.
在快速滑移之后,观察到了缓慢的压实(数百毫秒)。此外,与现场的同震膨胀不同,在我们的实验中,在快滑移开始时观测到了非常快(约 $2$ 毫秒)的压实(图 2C)。虽然我们实验中使用的玻璃球与真实的断层破碎带相比有所简化,但它们都是颗粒材料,具有类似的潜在粘滑机制。该实验室实验结果与现场地震观测结果一致,这表明我们的观测结果对真实地震的机理有一定的启发意义。
It was reported that slow earthquakes may play roles in stress transfer and stress redistribution in faults, thus triggering fast earthquakes. Fast and slow slip modes may occur in the same fault, which indicates that the occurrence of fast and slow earthquakes has more complex mechanism. Our experimental observations reveal that the fast and slow slip modes would occur in the same granular assemblies without changing the external loading conditions.
The sample thickness dilated during slow-slip events, which accelerated the dilation of stick progress. Therefore, the force chain structure after slow slips is more likely to trigger fast slip; this is consistent with field observations.
据报道,慢地震可能在断层的应力传递和应力再分布中发挥作用,从而引发快地震。快慢滑移模式可能发生在同一断层中,这表明快慢地震的发生机制更为复杂。我们的实验观察表明,在不改变外部加载条件的情况下,快慢滑移模式会在相同的颗粒聚合体中发生。
在慢滑动过程中,样品厚度扩张,这加速了粘连的扩张进程。因此,慢速滑移后的力链结构更有可能引发快速滑移;这与现场观测结果一致。
The synchronous high-resolution time sequences from the exper- iments allow us to understand the mechanism that fast-slip and slow-slip events are different slip instability modes for the same granular fault. Our observations, on the same glass sphere assemblies, indicate fast and slow slip modes that are controlled by the failure modes of strong and weak force chains, respectively. We believe that the deformation and failure of strong and weak force chains also controls the slip mechanism of fast and slow earthquakes in the field.
实验的同步高分辨率时间序列使我们能够理解快滑和慢滑事件是同一颗粒断层的不同滑动不稳定模式的机理。我们在同一玻璃球聚合体上的观测结果表明,快滑和慢滑模式分别受控于强力链和弱力链的破坏模式。我们认为,强力链和弱力链的变形和破坏也控制着现场快速地震和慢速地震的滑移机制。
Our experiment is a physical mechanical model of seismic mechanism; we also understand that it takes a long time to establish a bridge between physical model and natural setting through physical experiments. This study provides important insights on the slip mechanisms that fast and slow earthquakes would occur in the same granular fault, and the effect of structure rearrangement and stress redistribution in faults must be taken into account when formulating models for fast earthquake prediction.
我们的实验是地震机制的物理力学模型;我们也明白,通过物理实验在物理模型和自然环境之间建立桥梁需要很长时间。这项研究对同一颗粒断层发生快慢震的滑动机制提供了重要启示,在建立快震预测模型时,必须考虑断层中结构重排和应力重分布的影响。
Furthermore, we believe that it is necessary to visually observe the force chain structural variation of the granular assemblies in the process of high-resolution synchronous acquisition. It will further provide the physical mechanism of fast and slow slip failure in granular materials and then provide significant insights to fast and slow earthquake slip models.
此外,我们认为有必要在高分辨率同步采集过程中直观观察颗粒集合体的力链结构变化。这将进一步提供颗粒材料快慢滑失效的物理机制,进而为地震快慢滑模型提供重要启示。