Abstract
Strong earthquakes with larger magnitude and longer durations trigger many landslides, however, how magnitude and duration affect landslides is still unclear. Many factors could contribute to this, including additional shear stress provided by strong ground motion, or “seismogenic liquefaction”; herein, we hypothesize that the dynamic weakening of sliding zone gouge is important. We explored the influence of earthquake magnitude and duration on landslide triggering by simulating the seismic response of sliding zone gouge using a dynamic ring-shear device and glass spheres.
震级较大、持续时间较长的强震会引发许多滑坡,但震级和持续时间如何影响滑坡仍不清楚。造成这种情况的因素有很多,包括强地面运动提供的额外剪应力或 “地震引起的液化”;在此,我们假设滑动带冲沟的动态削弱非常重要。我们通过使用动态环剪装置和玻璃球模拟滑动带冲沟的地震响应,探讨了地震震级和持续时间对滑坡触发的影响。
The experiments showed that vibration with larger amplitudes and longer durations more easily trigger deformation and even instability in dry granular materials. We used a dynamic triaxial-bender system to find that the shear modulus of these materials decreased with the increase in duration and amplitude of cyclic loading. We suggest that this universal decrease in shear modulus is an important landslide-trigger mechanism. Our results revealed how magnitude and duration of earthquakes affect co-seismic landslides and why earthquakes with larger magnitude and long durations can trigger more co-seismic landslides.
实验表明,振幅较大、持续时间较长的振动更容易引发干颗粒材料的变形甚至失稳。我们使用动态三轴弯曲系统发现,这些材料的剪切模量随着循环加载持续时间和振幅的增加而降低。我们认为,这种剪切模量的普遍降低是一种重要的滑坡触发机制。我们的研究结果揭示了地震的震级和持续时间如何影响共震滑坡,以及为什么震级大、持续时间长的地震会引发更多的共震滑坡。
Introduction
Strong earthquakes are known to trigger large numbers of landslides in susceptible terrain (Chigira et al., 2010; Huang & Fan, 2013; Keefer, 1984, 2002; Massey et al., 2020). For instance, the 1999 Chi-chi Mw 7.6 earthquake in Taiwan caused 26,000 co-seismic landslides (Wang et al., 2002), the 2008 Wenchuan Mw 8.0 earthquake in China triggered more than 60,000 landslides (Huang & Fan, 2013), and the 2016 Kaikoura Mw 7.8 earthquake in New Zealand triggered 29,519 landslides (Massey et al., 2020). Studies of the seismic response of slope materials and the triggering mechanisms of slope instability are needed to improve the prediction of earthquake-triggered landslides (Indraratna et al., 2013).
众所周知,强震会在易受影响的地形中引发大量山体滑坡(Chigira 等人,2010 年;Huang & Fan,2013 年;Keefer,1984 年,2002 年;Massey 等人,2020 年)。例如,1999 年台湾地区发生的 Mw 7.6 奇奇地震引发了 26,000 次同震滑坡(Wang 等人,2002 年),2008 年中国汶川发生的 Mw 8.0 地震引发了 60,000 多次滑坡(Huang & Fan,2013 年),2016 年新西兰凯库拉发生的 Mw 7.8 地震引发了 29,519 次滑坡(Massey 等人,2020 年)。需要对边坡材料的地震响应和边坡不稳定性的触发机制进行研究,以改进对地震触发滑坡的预测(Indraratna 等人,2013 年)。
The magnitude, duration, and frequency of seismic waves are important in earthquakes (Papazachos et al., 1982), and the distribution of earthquake-triggered landslides has been shown to correlate with these factors (Delgado et al., 2011; Jibson & Tanyaş, 2020; Keefer, 1984; Malamud et al., 2004; Martha et al., 2016). Based on a large dataset of earthquake-triggered landslide inventories, the maximum distribution area of triggered landslides is positively correlated with earthquake magnitude (Delgado et al., 2011; Keefer, 1984; Malamud et al., 2004), strong ground acceleration (Martha et al., 2016) and duration, and negatively correlated with the frequency of the seismic waves (Jibson & Tanyaş, 2020).
地震波的震级、持续时间和频率在地震中非常重要(Papazachos 等人,1982 年),而地震引发的滑坡分布已被证明与这些因素相关(Delgado 等人,2011 年;Jibson & Tanyaş,2020 年;Keefer,1984 年;Malamud 等人,2004 年;Martha 等人,2016 年)。根据地震诱发滑坡的大量数据集,诱发滑坡的最大分布面积与地震震级(Delgado 等人,2011 年;Keefer,1984 年;Malamud 等人,2004 年)、强地面加速度(Martha 等人,2016 年)和持续时间呈正相关,与地震波频率呈负相关(Jibson & Tanyaş,2020 年)。
In general, the database shows that the distribution of earthquake-triggered landslides has regularities related to the amplitude, frequency and duration of seismic waves. However, research on the absolute impact of individual factors is still limited. Laboratory experiments can be used to isolate the influence of individual factors. Through sliding-block vibration experiments, Wang (1977) systematically summarized the influence of vibration factors, finding that large vibration amplitude, lower frequency and longer duration are more likely to trigger sliding. More controlled vibration shear experiments with granular materials are needed to further study the characteristics of seismic response and confirm the results of these initial studies.
总体而言,数据库显示地震引发的滑坡分布与地震波的振幅、频率和持续时间有关。然而,对个别因素绝对影响的研究仍然有限。实验室实验可用于分离个别因素的影响。Wang (1977) 通过滑动块振动实验系统地总结了振动因素的影响,发现大振幅、低频率和长持续时间更容易引发滑动。为了进一步研究地震反应的特点,并证实这些初步研究的结果,需要对颗粒材料进行更多的受控振动剪切实验。
Some mechanisms have been proposed to explain landslide triggering by earthquakes. Ground-motion acceleration provides additional shear stress (SS), and can cause the SS on the sliding surface to exceed the shear resistance (Dai et al., 2011; Lacroix et al., 2014; Meunier et al., 2007, 2008; Newmark, 1965; Wang & Zhang, 1982). Seismic loading can cause “seismogenic liquefaction” of the saturated layer above the sliding surface, leading to a drop in effective normal stress, and thus causing a decline in shear resistance on the sliding surface (Cui et al., 2016; Sassa et al., 2004, 2007; Wang et al., 2013; Wang, Huang, et al., 2014; Wang, Suemine, et al., 2014; Xu et al., 2012).
人们提出了一些机制来解释地震引发滑坡的原因。地动加速度提供了额外的剪应力(SS),可导致滑动面上的 SS 超过抗剪能力(Dai 等人,2011 年;Lacroix 等人,2014 年;Meunier 等人,2007 年、2008 年;Newmark,1965 年;Wang & Zhang,1982 年)。地震荷载会导致滑动面上的饱和层发生 “地震液化”,导致有效法向应力下降,从而导致滑动面的抗剪能力下降(Cui 等人,2016 年;Sassa 等人,2004 年,2007 年;Wang 等人,2013 年;Wang、Huang 等人,2014 年;Wang、Suemine 等人,2014 年;Xu 等人,2012 年)。
Multiple ground motion cycles crush soil grains and fracture rock masses on the shearing plane, decreasing the shear resistance of the sliding surface (Bontemps et al., 2020; Meunier et al., 2008). This mechanism can explain the amplitude and duration effects of earthquake-triggered landslides in dry or wet conditions, but field validation and quantitative analysis are lacking.
多重地动周期会挤压剪切面上的土粒并使岩块断裂,从而降低滑动面的抗剪性(Bontemps 等人,2020 年;Meunier 等人,2008 年)。这一机制可以解释地震引发的滑坡在干燥或潮湿条件下的振幅和持续时间效应,但目前还缺乏实地验证和定量分析。
We propose that dynamic weakening of the shear modulus of the sliding zone gouge has a function in landslide triggering because many researchers observe a temporary decrease in shear modulus or shear-wave velocity under vibration in the laboratory and field (Bontemps et al., 2020; Jia et al., 2011; Johnson et al., 2008, 2012, 2016; Johnson & Jia, 2005; Léopoldès et al., 2020; Zhou & Chen, 2005). But experimental and field evidence on how earthquakes with different amplitudes and durations affect shear modulus and how shear modulus changes affect slip and instability are still lacking.
我们提出滑动带冲沟剪切模量的动态减弱在滑坡触发中具有一定作用,因为许多研究人员在实验室和野外观测到剪切模量或剪切波速度在振动作用下的暂时性降低(Bontemps 等,2020;Jia 等,2011;Johnson 等,2008、2012、2016;Johnson & Jia,2005;Léopoldès 等,2020;Zhou & Chen,2005)。但是,关于不同振幅和持续时间的地震如何影响剪切模量以及剪切模量变化如何影响滑移和不稳定性的实验和现场证据仍然缺乏。
Therefore, we conducted ring-shear cyclic loading tests with different amplitudes and durations using $0.2–0.4 \text{mm}$ glass spheres ($\text{SiO}_{2}$) in a dry condition. At the same time, we recorded acoustic emission (AE) signals using an AE acquisition system. Moreover, we measured changes in shear modulus of the same material using a dynamic triaxial bender system. Our study highlighted the influence of vibration duration and amplitude on triggering and the effect of shear modulus changes.
因此,我们使用 $0.2-0.4 \text{mm}$ 的玻璃球($\text{SiO}_{2}$)在干燥条件下进行了不同振幅和持续时间的环剪循环加载试验。同时,我们使用声发射(AE)采集系统记录了声发射(AE)信号。此外,我们还使用动态三轴弯曲系统测量了相同材料的剪切模量变化。我们的研究强调了振动持续时间和振幅对触发的影响以及剪切模量变化的影响。
Apparatus and Methods
We used a ring shear apparatus to study the mechanical behavior of samples of dry glass spheres ($\text{SiO}_{2}$) under cyclic loading and used triaxial tests to monitor the evolution of the shear modulus of samples under cyclic loading.
我们使用环剪仪器研究了干玻璃球($\text{SiO}_{2}$)样品在循环加载下的机械行为,并使用三轴试验监测了样品在循环加载下剪切模量的演变。
In nature, co-seismic landslides may be affected by many types and different directions of seismic waves. These seismic waves, acting on the sliding zone, can be resolved into components of seismic acceleration vertical and parallel to the sliding surface (Figure 1a). The ring shear instrument can apply dynamic loading of different amplitudes and durations to granular materials while providing constant normal stresses and SSs, simulating the natural stress state of sliding zone gouge under seismic waves (Figure 1b). Glass spheres are widely used in laboratory experiments to study the geophysical mechanisms of fault (Jia et al., 2011; Johnson et al., 2008, 2012, 2016; Johnson & Jia, 2005; Léopoldès et al., 2020). In our experiments, the granular medium was composed of glass spheres ($\text{SiO}_{2}$) with a diameter of $0.2–0.4\text{ mm}$.
在自然界中,共震滑坡可能会受到多种类型和不同方向的地震波影响。这些作用于滑动带的地震波可分为垂直于滑动面和平行于滑动面的地震加速度分量(图 1a)。环形剪切仪可以对颗粒材料施加不同振幅和持续时间的动态载荷,同时提供恒定的法向应力和 SS,模拟地震波作用下滑动区沟槽的自然应力状态(图 1b)。玻璃球在实验室实验中被广泛用于研究断层的地球物理机制(Jia 等人,2011 年;Johnson 等人,2008 年、2012 年、2016 年;Johnson & Jia,2005 年;Léopoldès 等人,2020 年)。在我们的实验中,颗粒介质由直径为 $0.2-0.4$ 毫米的玻璃球(二氧化硅)组成。
玻璃球在进行非线性实验的时候, 也具有优异于细致颗粒的表现
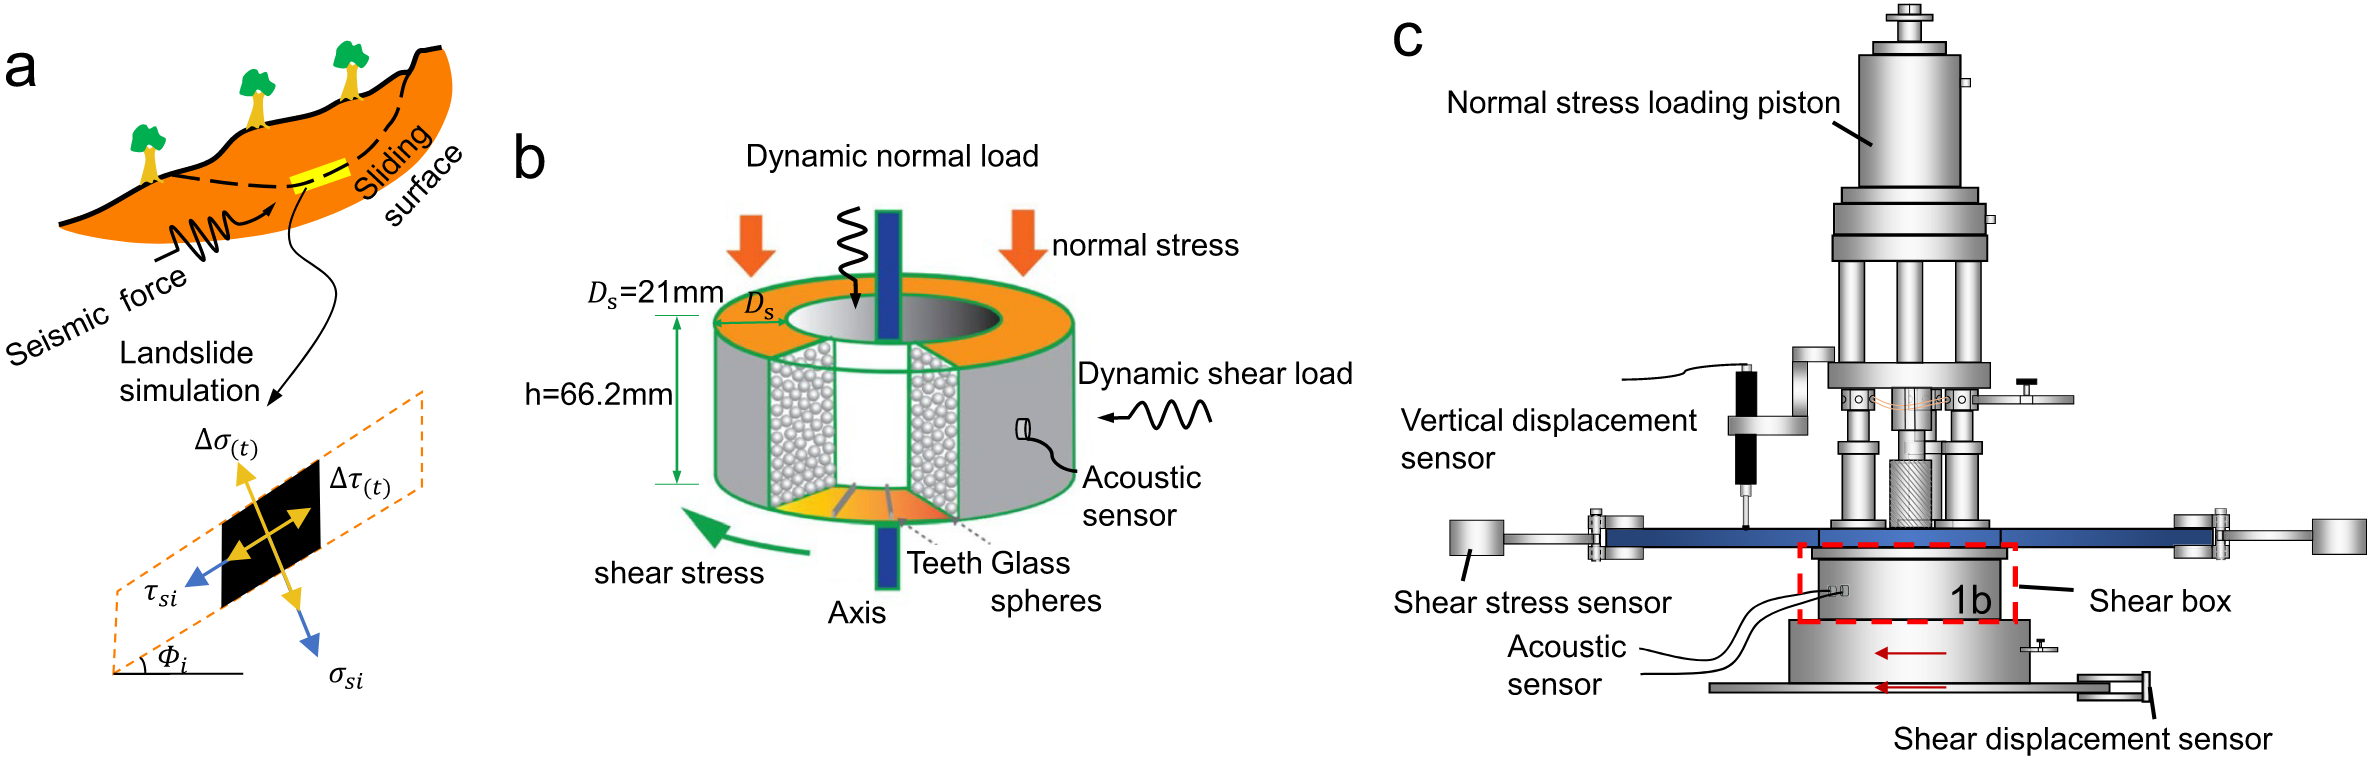
The model of co-seismic landslide and ICL-2 ring shear apparatus. (a) Model of landslide sliding zone and mechanical model of unit cell under seismic force. (b) Physical model of ring shear experiment. (c) Schematic of ICL-2 ring shear test system. Section modified from Cui et al. (2016). $\sigma_{si}$ - static normal stress, $\tau_{si}$ – static shear stress, $\Delta\tau_{(t)}$ – dynamic shear stress, $\Delta\sigma_{(t)}$ – dynamic normal stress.
同震滑坡模型和 ICL-2 环剪装置。(a) 滑坡滑动带模型和地震力作用下的单元力学模型。(b) 环剪实验的物理模型。(c) ICL-2 环剪试验系统示意图。部分修改自 Cui 等人(2016)。$\sigma_{si}$ - 静态法向应力,$\tau_{si}$ - 静态剪应力,$\delta\tau_{(t)}$ - 动态剪应力,$\delta\sigma_{(t)}$ - 动态法向应力。
Dynamic Ring Shear Apparatus
We used ring shear cyclic loading testing to study the dynamic response of dry granular materials. The setup of the ring shear apparatus is shown in Figure 1c. In the experiments, firstly, $0.2–0.4\text{ mm}$ glass spheres ($\text{SiO}_{2}$) were placed in a ring shear box ($H = 66.2\text{ mm}$, $D_{s} = 21\text{ mm}$) with an initial density of $1.52\text{ g/cm}^{3}$ (initial total porosity of $37.7\%$), and constant normal stress and constant SS were then applied.
我们使用环剪循环加载试验来研究干颗粒材料的动态响应。环剪装置的设置如图 1c 所示。在实验中,首先将$0.2-0.4\text{ mm}$玻璃球($\text{SiO}_{2}$)置于初始密度为 $1.52\text{ g/cm}^{3}$ (初始总孔隙率为 $37.7\%$)的环剪盒($H = 66.2\text{ mm}$,$D_{s} = 21\text{ mm}$)中,然后施加恒定法向应力和恒定 SS。
Then, under these stress states, sinusoidal cyclic SS or cyclic normal stress with different numbers of cycles and amplitudes were applied respectively. In the experiments, the frequency of cyclic loading was $1\text{ Hz}$ ($1\text{ cycle/s}$), which can represent the typical dominant frequencies of the earthquake ground motions (Trifunac, 2008; Wang et al., 2013). Test conditions are shown in Table 1. Further details of the ring shear apparatus are given in Supporting Information S1.
然后,在这些应力状态下,分别施加不同循环次数和振幅的正弦循环 SS 或循环法向应力。在实验中,循环加载的频率为 $1\text{ Hz}$ ($1\text{ cycle/s}$),这可以代表地震地面运动的典型主导频率(Trifunac,2008;Wang 等人,2013)。测试条件如表 1 所示。环剪装置的更多详情见佐证资料 S1。
Acoustic Emission Acquisition System
During these ring shear experiments, continuous acquisition, collected by an NI (National Instrument Company, USA) compact DQA, PXle-1084 & BNC-2110 acoustic emission sensor (WD), was installed near the shear zone to record the elastic waves generated in the experiments (Figure 1b).
在这些环形剪切实验中,由安装在剪切区附近的 NI(美国国家仪器公司)紧凑型 DQA、PXle-1084 和 BNC-2110 声发射传感器(WD)进行连续采集,以记录实验中产生的弹性波(图 1b)。
AE signals were amplified by $40\text{ dB}$ and digitized with a sampling rate of $1\text{ MHz}$. The sampling rate of $1\text{ MHz}$ is much higher than the $1\text{ Hz}$ vibration frequency and can distinguish data in the $0–500,000\text{ Hz}$ frequency range. The time-frequency diagrams were obtained from the short-time Fourier transform of the AE signals. The setup of AE acquisition system is shown in Figure S1 in Supporting Information S1.
AE 信号被放大了 $40\text{ dB}$,并以 $1\text{ MHz}$ 的采样率被数字化。$1\text{ MHz}$ 的采样率远高于 $1\text{ Hz}$ 的振动频率,可以分辨出 $0-500,000\text{ Hz}$ 频率范围内的数据。时频图由 AE 信号的短时傅里叶变换得到。AE 采集系统的设置如图 S1(见佐证资料 S1)所示。
Dynamic Triaxial-Bender Systems
To study the evolution of the shear modulus of the sample during cyclic loading, we conducted a set of dynamic triaxial bender experiments. In the experiment, $0.2–0.4\text{ mm}$ glass spheres were used to make a specimen with a height of $200\text{ mm}$, a diameter of $100\text{ mm}$, and an initial density of $1.569\text{ g/cm}^{3}$ (initial total porosity of $35.7\%$). The specimen was put into a triaxial cell, and a confining pressure of $300\text{ kPa}$ and deviatoric stress of $380\text{ kPa}$ were applied. Sinusoidal cyclic dynamic loads with amplitudes of $15\text{ kPa}$, $45\text{ kPa}$, and $75\text{ kPa}$, a frequency of $1\text{ Hz}$ ($1\text{ cycle/s}$) and a cycle number of $200$ were applied.
为了研究试样在循环加载过程中剪切模量的变化,我们进行了一组动态三轴弯曲实验。在实验中,我们用 $0.2–0.4\text{ mm}$ 的玻璃球制作了一个高度为$200\text{ mm}$ 、直径为 $100\text{ mm}$、初始密度为 $1.569\text{ g/cm}^{3}$(初始总孔隙率为 $35.7\%$)的试样。将试样放入三轴样品池中,施加 $300\text{ kPa}$ 的约束压力和 $380\text{ kPa}$ 的偏差应力。施加振幅分别为 $15\text{kPa}$、$45\text{kPa}$ 和 $75\text{kPa}$、频率为 $1\text{Hz}$($1\text{ cycle/s}$)、循环次数为 $200$ 的正弦循环动载荷。
The frequency was the same as that in the ring shear test. During the dynamic loading, we used a bender element system to obtain the corresponding change in the shear modulus of the specimen with an interval time of $273\text{ ms}$. In the ring shear and dynamic triaxial experiments, the glass spheres were under dry conditions (room humidity) and remained unbroken in the samples. The setup of the dynamic triaxial bender system is shown in Figure 2. Further details on this system are given in Supporting Information S1.
频率与环剪试验中的频率相同。在动态加载过程中,我们使用弯管元件系统来获取试样剪切模量的相应变化,其间隔时间为 $273\text{ ms}$。在环剪和动态三轴实验中,玻璃球处于干燥条件下(室内湿度),并在试样中保持不损坏。动态三轴应力系统的设置如图 2 所示。有关该系统的更多详细信息,请参见佐证资料 S1。
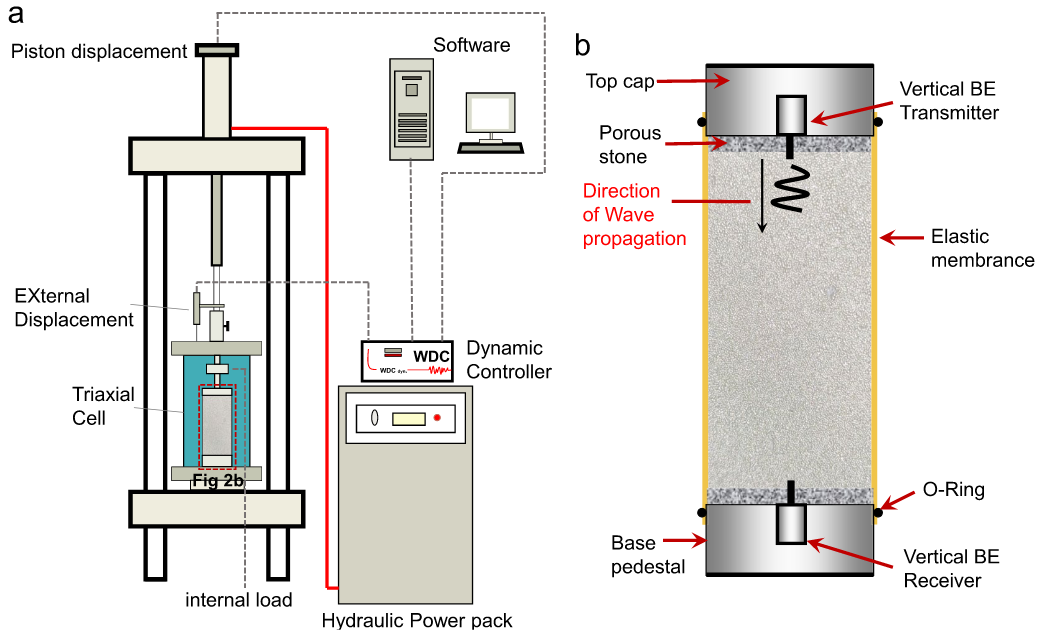
Dynamic triaxial test system with bender element. (a) Schematic of dynamic triaxial test system. (b) Bender elements on a triaxial sample.
带弯管元件的动态三轴测试系统。(a) 动态三轴测试系统示意图。(b) 三轴样品上的弯曲元件。
The bender element system obtains the small-strain shear modulus ($G_{\text{max}}$) of the sample by measuring the shear wave propagation velocity (Shirley & Hampton, 1978), while the small-strain shear modulus is close to the maximum shear modulus, as the bender element test causes minimal disturbance to the specimen. The calculation method is as follows:
$$ \begin{aligned} V_{s} &= \frac{H}{T_{a}-T_{0}}\\ G_{\text{max}} &= \rho V_{s}^{2} \end{aligned} $$
where $V_{s} =$ shear wave velocity, $H =$ propagation distance (the distance from tip to tip between bender elements), $T_{a}=$ arrival time, $T_{0} =$ initial time, $G_{\text{max}}=$ small-strain shear modulus, and $\rho =$ bulk density of soil.
弯管元件系统通过测量剪切波传播速度获得样品的小应变剪切模量($G_{\text{max}}$)(Shirley & Hampton,1978 年),而小应变剪切模量接近最大剪切模量,因为弯管元件试验对样品的干扰最小。计算方法如下
$$ \begin{aligned} V_{s} &= \frac{H}{T_{a}-T_{0}}\\ G_{\text{max}} &= \rho V_{s}^{2} \end{aligned} $$
其中,$V_{s} =$ 剪切波速度,$H =$ 传播距离(弯管元件之间尖端到尖端的距离),$T_{a} =$ 到达时间,$T_{0} =$ 初始时间,$G_{\text{max}} =$ 小应变剪切模量,$\rho =$ 土壤容重。
Several methods of determining the propagation time of S-wave velocity have been proposed, such as a first break, peak-to-peak, cross-correlation, or a phase/frequency relationship (Clayton, 2011). In this study, the peak-to-peak method was used to determine the travel time of the S-wave, and the distance between the peak value of the transmitted wave and the first peak of the received wave was regarded as the propagation time (Figure 3).
目前已提出了几种确定 S 波速度传播时间的方法,例如首断法、峰-峰法、交叉相关法或相位/频率关系法(Clayton,2011 年)。本研究采用峰-峰法确定 S 波的传播时间,并将发射波的峰值与接收波的第一个峰值之间的距离视为传播时间(图 3)。
目前我们用的就是相似性参数来定义的波前
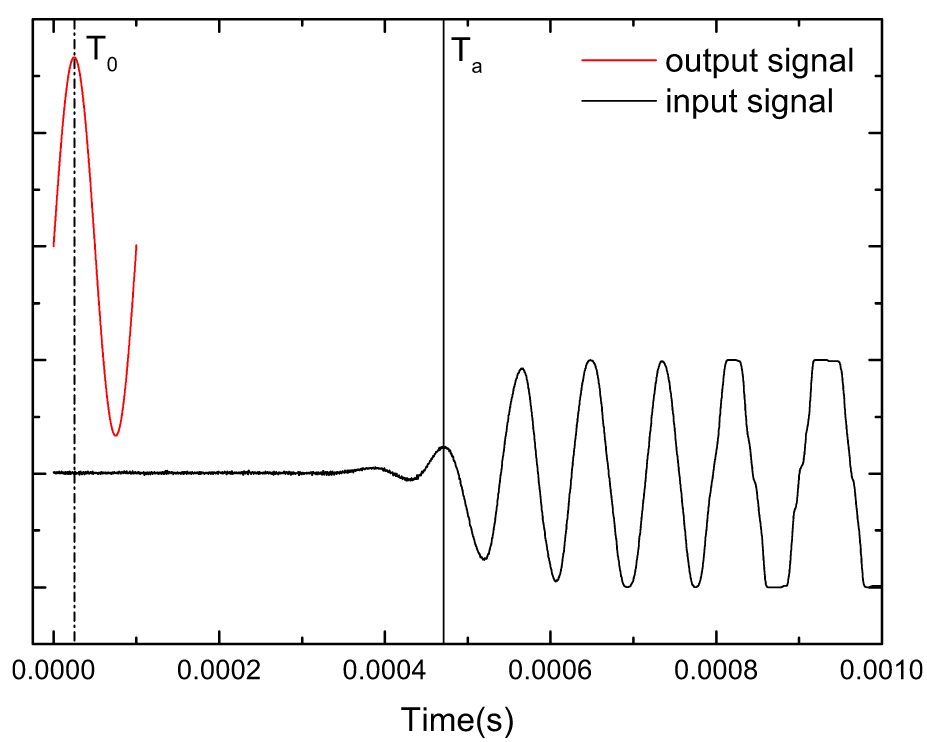
Typical record of transmitter and receiver signals of bender elements and identification of shear-wave traveling time feature points. $T_{0}$-initial time, $T_{a}$-arrival time.
弯管元件发射器和接收器信号的典型录像以及剪切波行进时间特征点的识别。$T_{0}$-初始时间,$T_{a}$-到达时间。
日期: 2023-10-09 标签: #read这里选取第一个峰是有依据的, 其定义具有最佳效果
Results
Dynamic Ring Shear Experiments With Different Numbers of Cycles (Duration of Vibration)
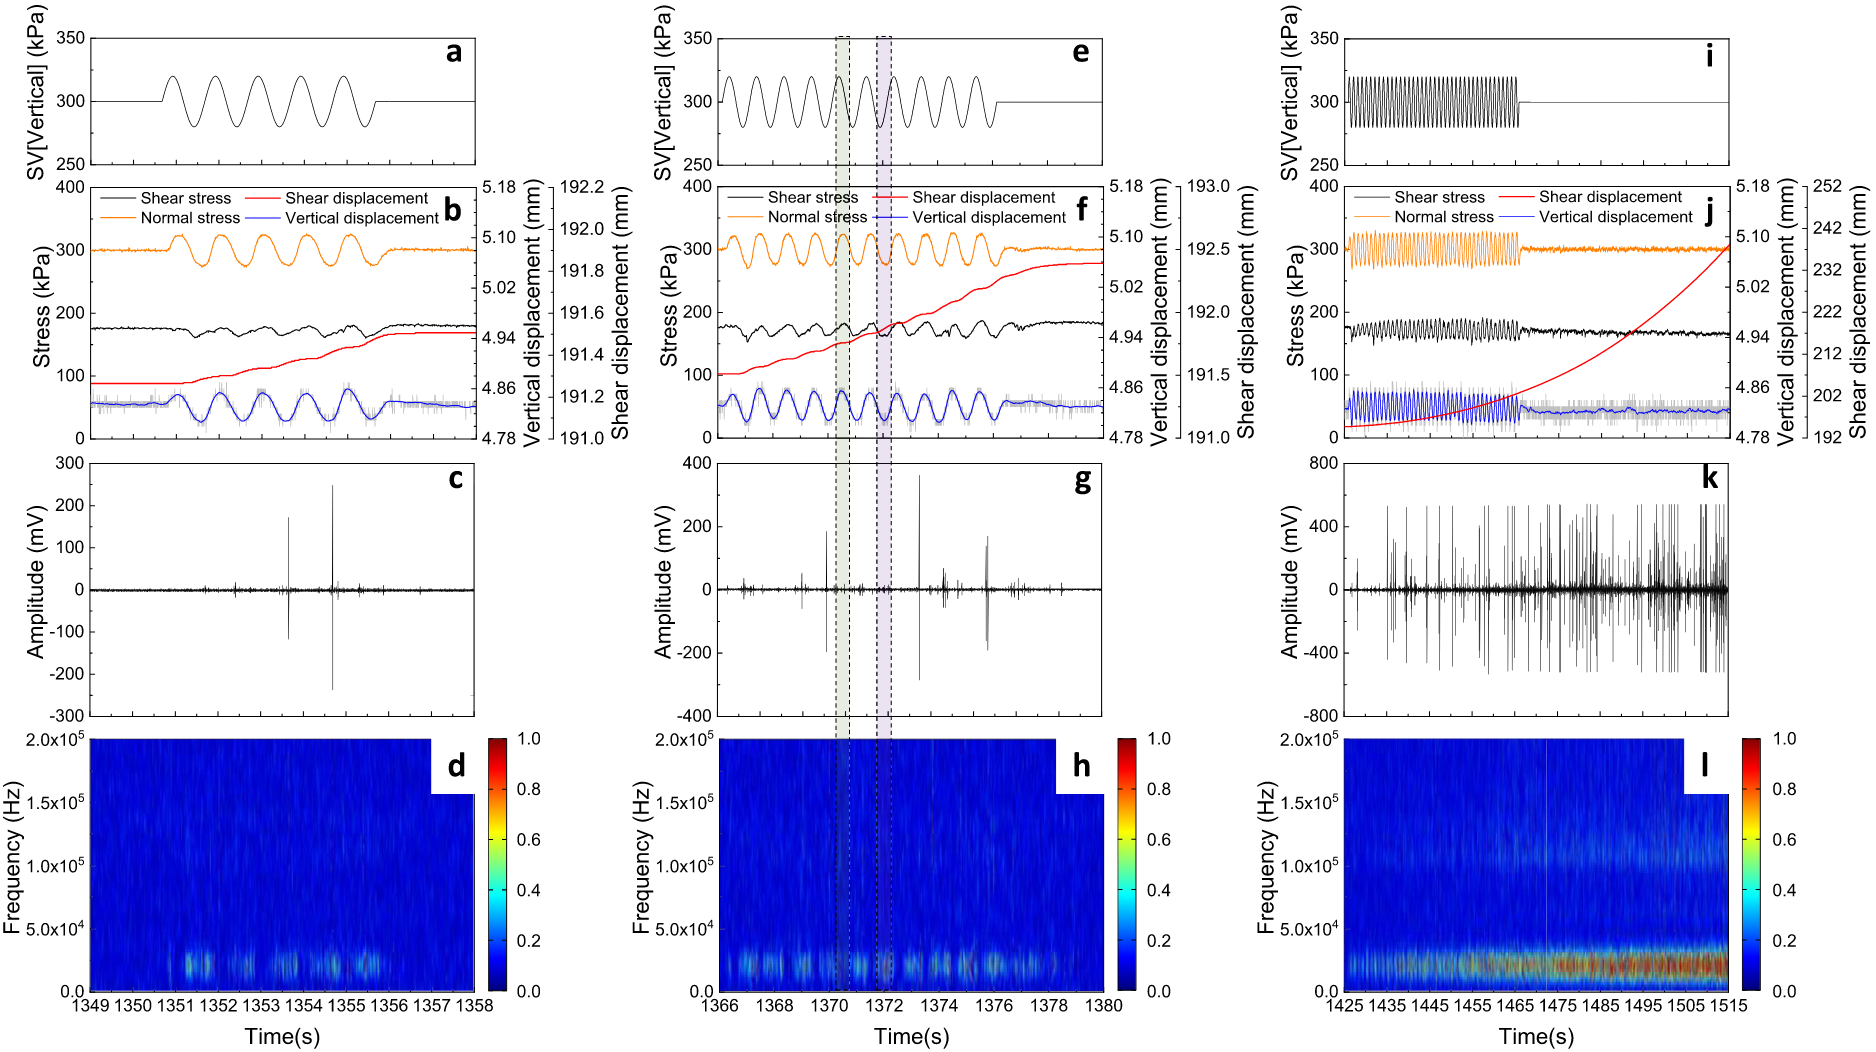
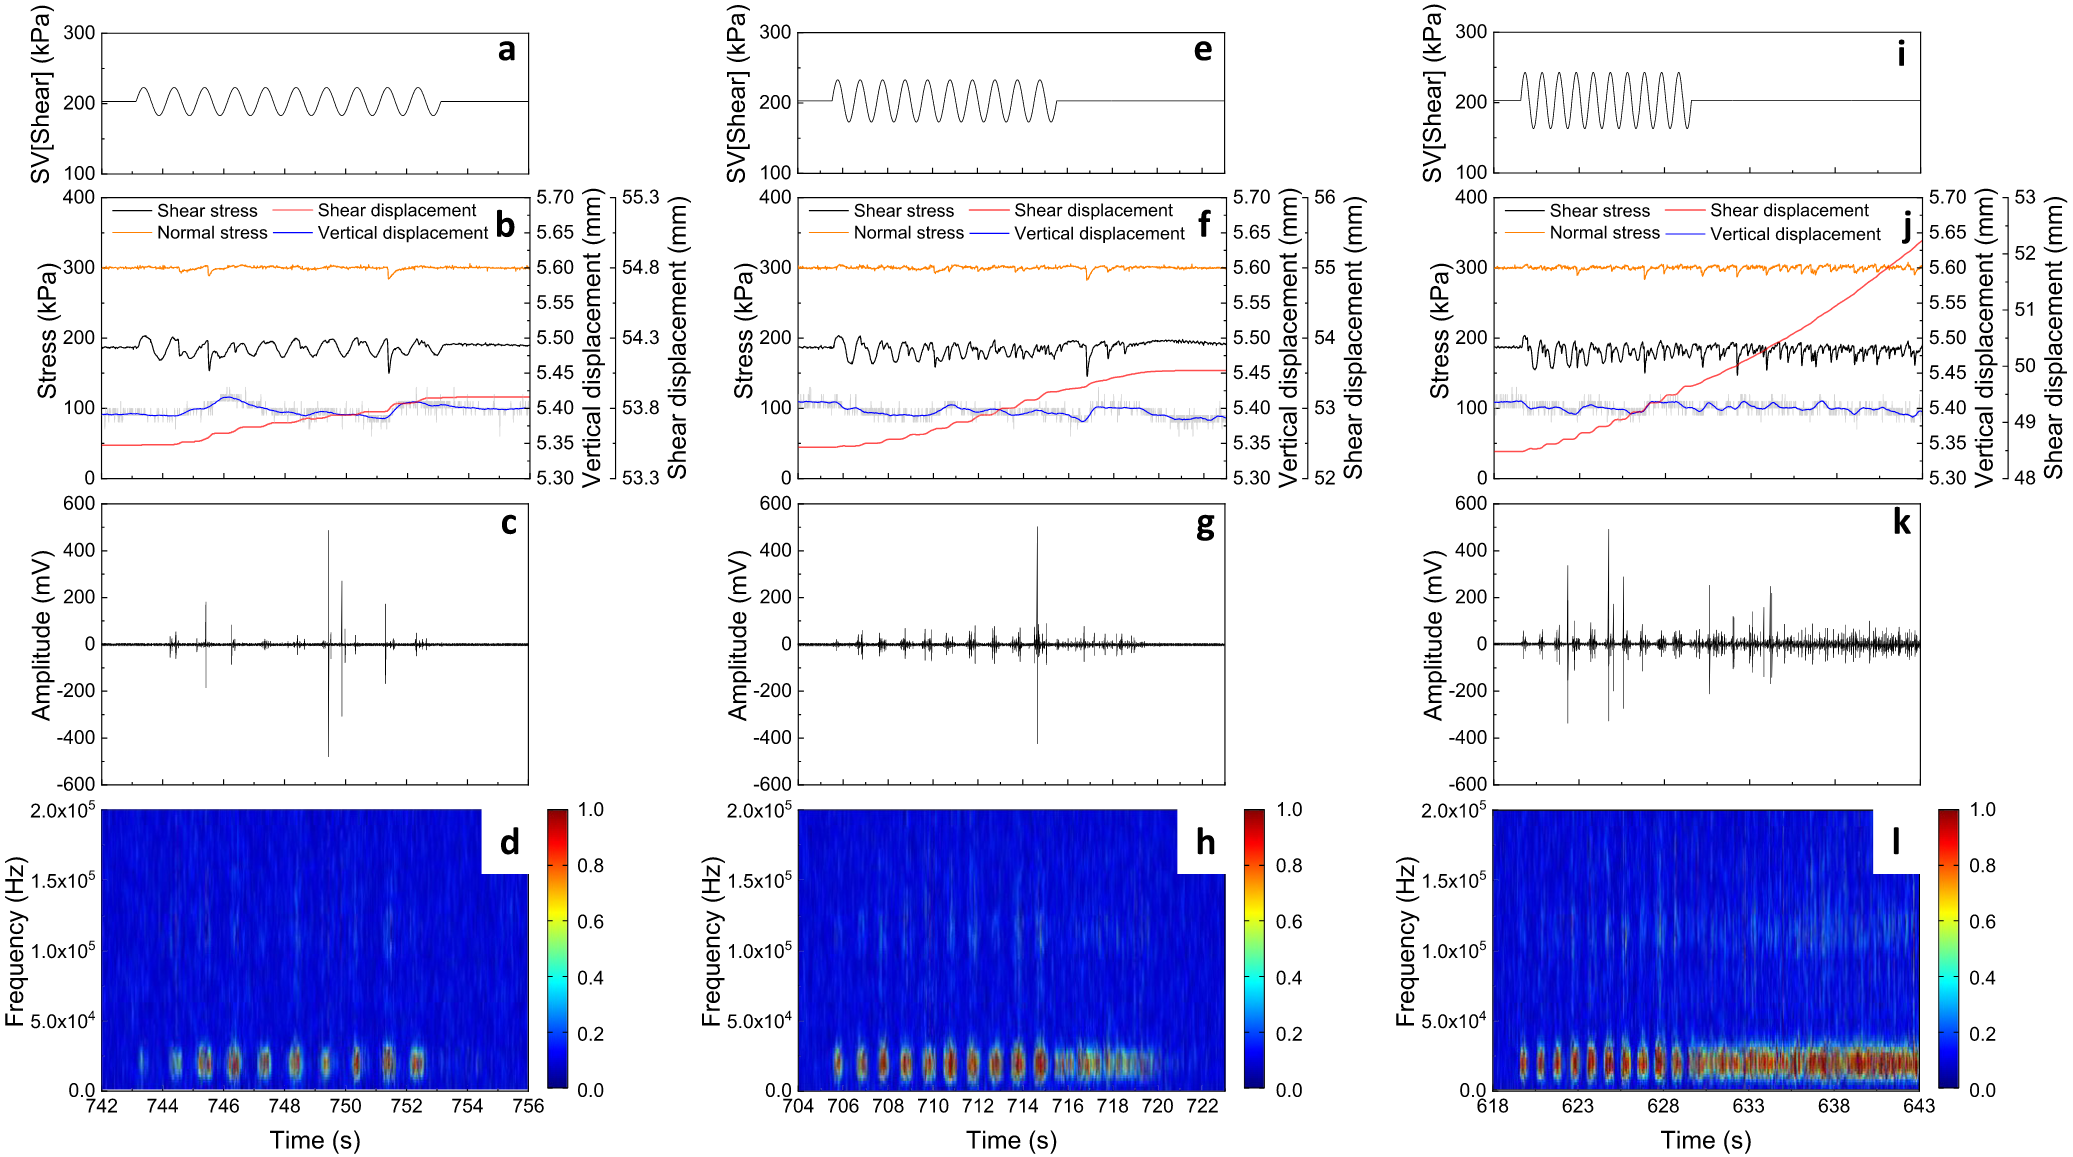
Figure 4 shows the ring shear experimental results under different numbers of cycles of sinusoidal dynamic shear loads with an amplitude of $30\text{ kPa}$ and frequency of $1\text{ Hz}$ under $300\text{ kPa}$ normal stress and $173\text{ kPa}$ SS (Test 1 to Test 3). The peak shear strength of the sample was $191\text{ kPa}$ (PSS), and the ratio of SS to PSS was $0.906$.
图4显示了在 $300\text{ kPa}$ 法向应力和 $173\text{ kPa}$ SS(试验 $1$ 至试验 $3$)下,不同循环次数的振幅为 $30\text{ kPa}$ 、频率为 $1\text{ Hz}$ 的正弦动态剪切载荷作用下的环剪试验结果。样品的峰值剪切强度为 $191\text{ kPa}$(PSS),SS 与 PSS 之比为 $0.906$。
The results show that shear displacement showed three different forms with differing numbers of cycles (Figures 4b, 4f and 4j). We defined the co-vibration slip and the post-vibration slip—the shear displacement of the sample during and after the vibration. For five cycles, the shear displacement only had a small co-vibration slip ($0.16\text{ mm}$), and the displacement stopped immediately as soon as the vibration ended (Figure 4b).
结果显示,剪切位移在不同的循环次数下呈现出三种不同的形式(图 4b、4f 和 4j)。我们定义了共振滑移和振后滑移–样品在振动过程中和振动后的剪切位移。在五个周期中,剪切位移只有很小的共振滑移($0.16\text{ mm}$),并且振动结束后位移立即停止(图 4b)。
For $10$ cycles, larger co-vibration slip occurred ($0.854\text{ mm}$), and a period of decelerating shear displacement ($0.534\text{ mm}$), known as the “relaxation period” (Bontemps et al., 2020), followed at the end of the vibration (Figure 4f). When the number of cycles was $20$, the shear displacement underwent $2.25\text{ mm}$ of co-vibration slip, and was followed by an accelerated motion that did not stop spontaneously after the vibration ended, showing the instability (Figure 4j).
当循环次数为 $10$ 时,发生了更大的共振滑移($0.854\text{ mm}$),并且在振动结束后出现了一段剪切位移减速期($0.534\text{ mm}$),即所谓的 “弛豫期”(Bontemps 等人,2020)(图4f)。当振动周期数为 $20$ 时,剪切位移经历了 $2.25\text{ mm}$ 的共振滑移,随后出现加速运动,且在振动结束后不会自发停止,显示出不稳定性(图 4j)。
The co-vibration and post-vibration shear displacements thus increased with an increase in the number of cycles, and the instability of granular materials can be triggered by a larger number of cycles.
因此,随着循环次数的增加,共振和振后剪切位移也随之增加,循环次数越多,颗粒材料越不稳定。
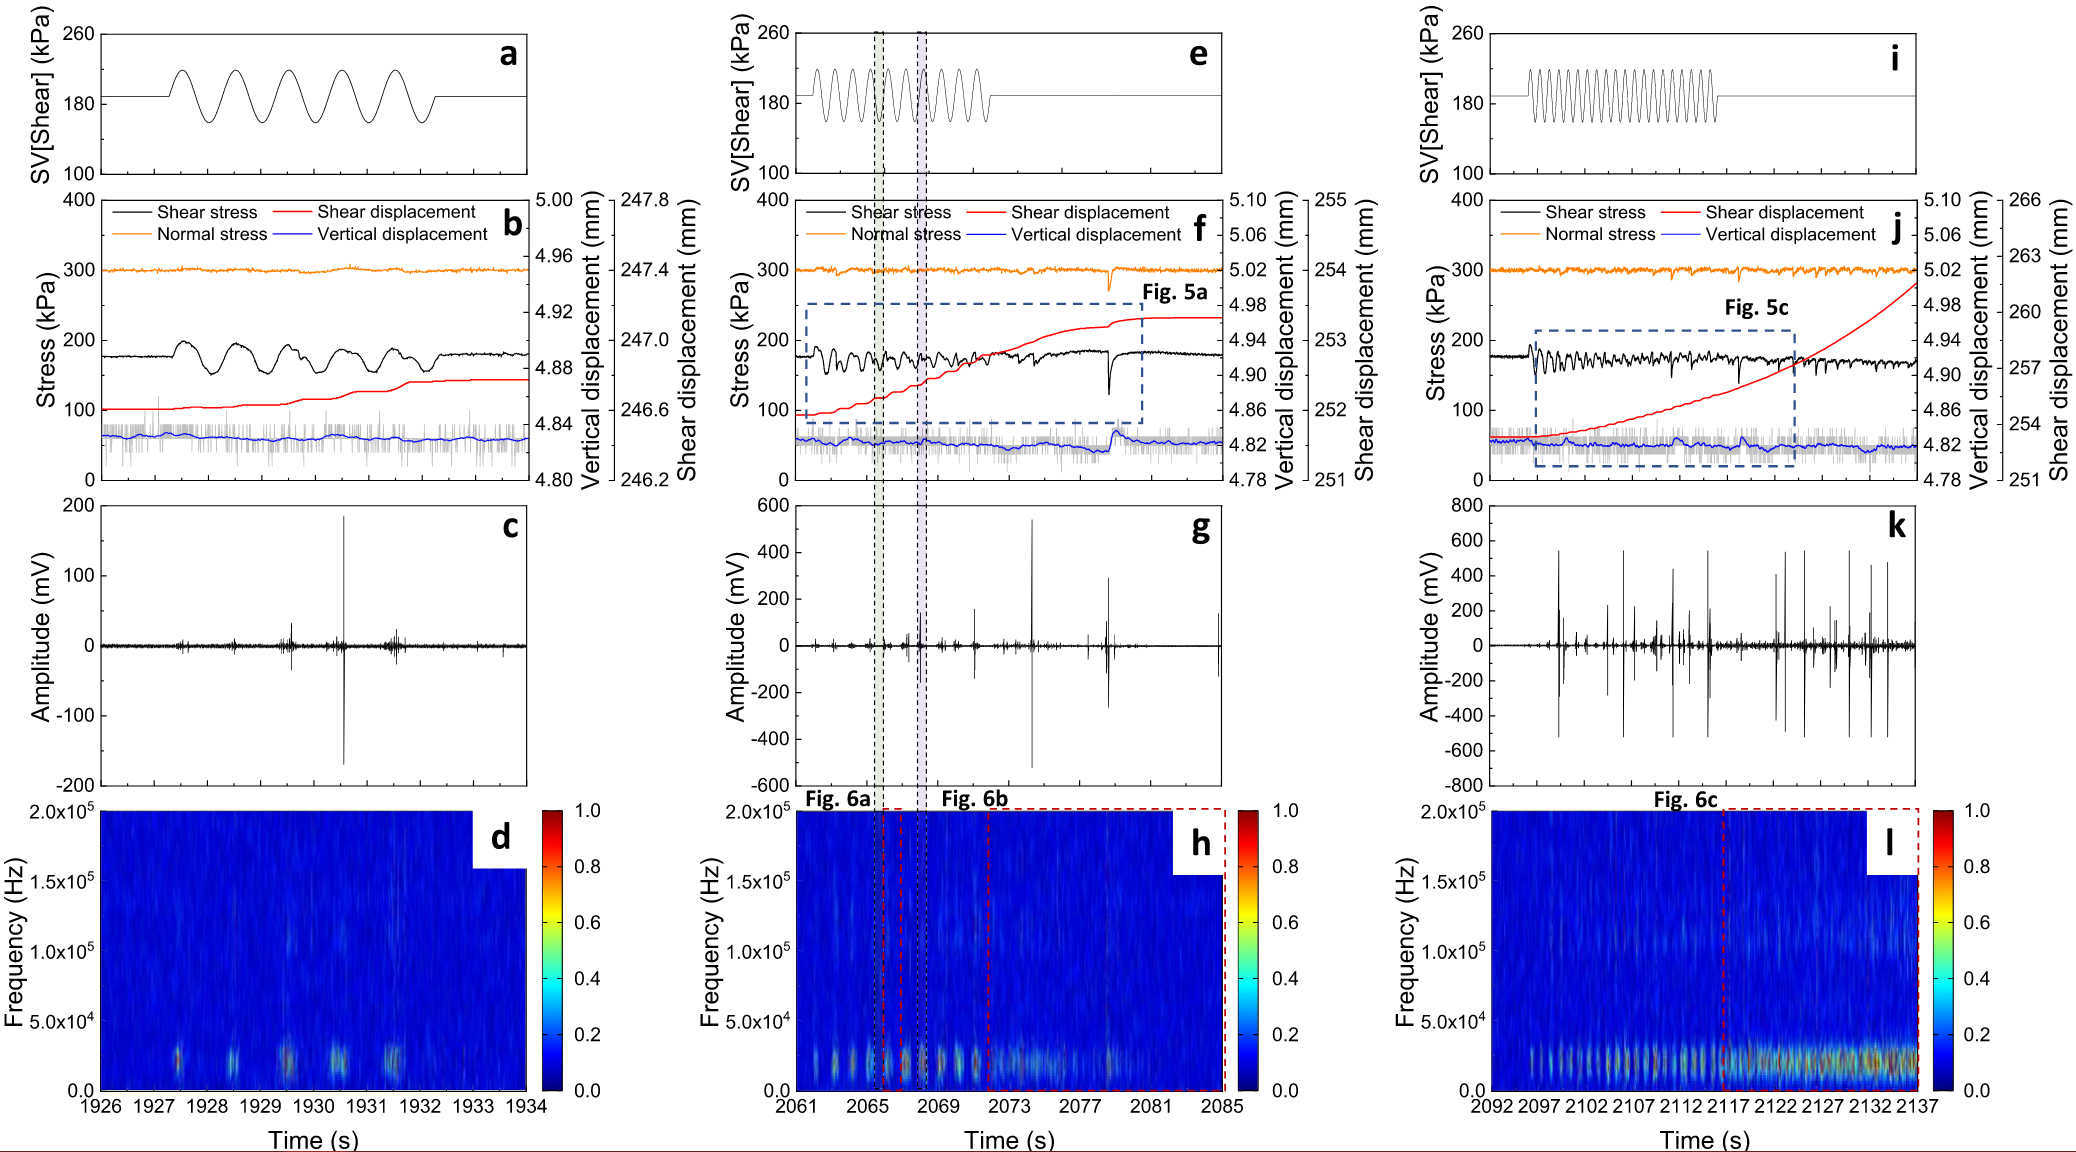
Cyclic shear loading tests at different numbers of cycles under $300\text{ kPa}$ normal stress and $173\text{ kPa}$ shear stress (Test 1 to Test 3). (a), (e), (i) are the graphs of the input sinusoidal dynamic load, the amplitude is $30\text{ kPa}$, the frequency is $1\text{ Hz}$, the number of cycles is 5, 10, and 20, respectively. (b), (f), (j) are the graphs of experimental results, showing the change of normal stress (orange line), shear stress (black line), shear displacement (red line), and vertical displacement (blue line). (c), (g), (k) are diagrams of acoustic emission original signals during the experiment. (d), (h), (l) are acoustic emission time-frequency diagrams during the experiment. In (e), (f), (g) and h, the green rectangle shows the platform segment of co-vibration shear displacement, and the purple rectangle shows the upward segment.
在 $300\text{ kPa}$ 法向应力和 $173\text{ kPa}$ 剪应力作用下进行的不同循环次数的循环剪切加载试验(试验 1 至试验 3)。(a)、(e)、(i) 是输入正弦动态载荷的曲线图,振幅为 $30\text{kPa}$,频率为 $1\text{Hz}$,循环次数分别为 5、10 和 20。(b)、(f)、(j) 为实验结果图,显示了法向应力(橙色线)、剪应力(黑色线)、剪切位移(红色线)和垂直位移(蓝色线)的变化。(c)、(g)、(k) 为实验期间声发射原始信号图。(d)、(h)、(l) 为实验过程中的声发射时频图。在(e)、(f)、(g)和(h)中,绿色矩形表示共振剪切位移的平台段,紫色矩形表示向上段。
It was also observed that vibrating the SS caused a stepwise increase of co-vibration shear displacement, but caused little change in normal stress and vertical displacement (Figures 4b, 4f and 4j). We enlarged the curves of shear displacement in Figures 4f and 4j (see Figure 5a and Figure 5c), respectively. The stepwise increase curves of co-vibration shear displacement show platform segments and upward segments (Figures 4f and Figures 5a, 5c); the platform segments corresponded to trough segments of cyclic SS, and the upward segments to crest segments of cyclic SS (Figure 4f).
我们还观察到,振动 SS 会导致共振剪切位移逐步增加,但法向应力和垂直位移变化不大(图 4b、4f 和 4j)。我们放大了图 4f 和图 4j 中的剪切位移曲线(分别见图 5a 和图 5c)。共振剪切位移的阶跃上升曲线显示了平台段和上升段(图 4f 和图 5a、5c);平台段对应于循环 SS 的波谷段,上升段对应于循环 SS 的波峰段(图 4f)。
It shows that the deformation was promoted by the increase of SS. Meanwhile, the curves also show that the shear displacement value of each upward segment was not the same, but increased with the increase in the number of vibration cycles, following a logarithmic law (Figures 5b and 5d). This means that the rate and acceleration of each upward segment increased with the increase in the number of vibration cycles. When the vibration ended, the co-vibration shear displacement remained stable in the form of the platform (Figures 5a and 5c), and the SS of the three experiments returned to an initially constant value.
这表明 SS 的增加促进了变形。同时,曲线还显示,每个上行段的剪切位移值并不相同,而是随着振动周期数的增加而增加,遵循对数规律(图 5b 和 5d)。这意味着每个上升段的速率和加速度随着振动周期数的增加而增加。振动结束后,共振剪切位移保持稳定的平台形式(图 5a 和 5c),三次实验的 SS 恢复到初始恒定值。
剪切, 振动…都可以被视为外部驱动, 并且被证明为等效温度. jia 也在文章中提到过有关于等效温度的想法, 这里有办法将声学驱动统一到 Edwards 框架内吗?
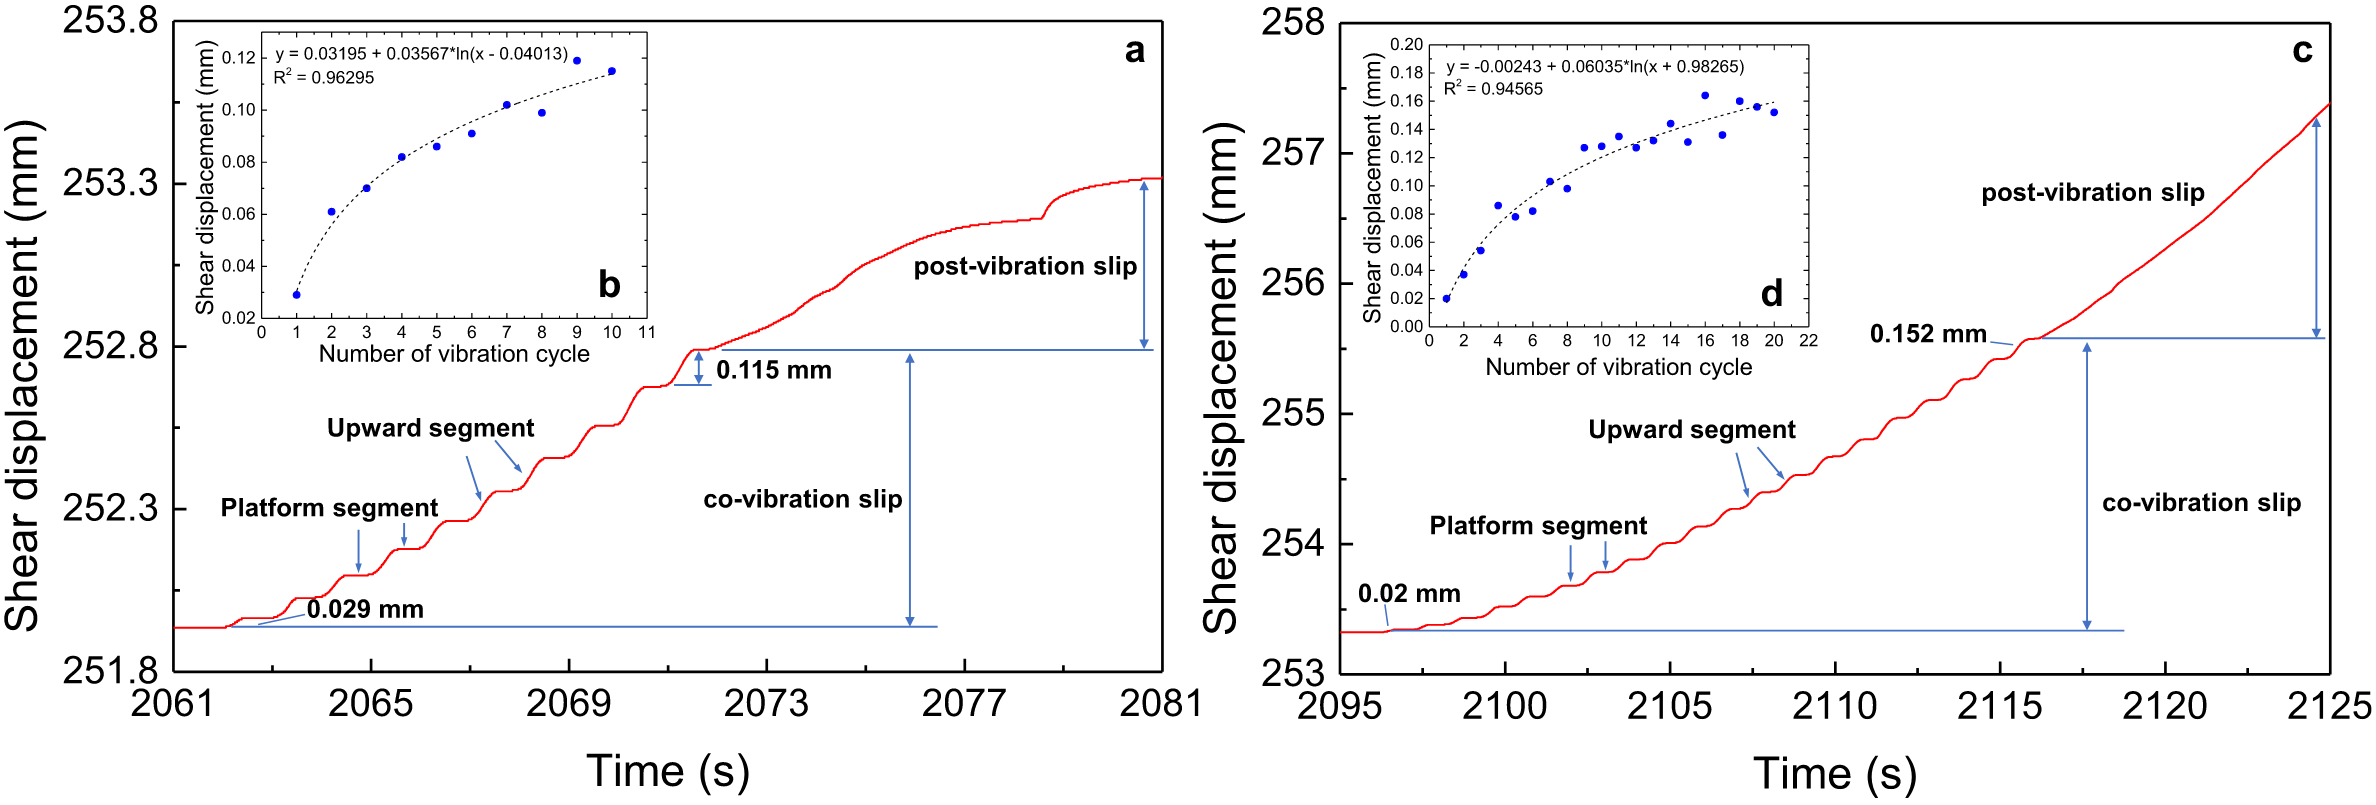
The changes of shear displacement. (a) and (c) are the changes of shear displacement including co-vibration slip and post-vibration slip, and show the stepwise increase of co-vibration slip, enlarged from Figures 4f and 4j. (b) and (d) show that the shear displacement of each upward segment increased with the increase in the number of vibration cycles.
剪切位移的变化。(a) 和 (c) 是包括共振滑移和振后滑移在内的剪切位移变化,显示了共振滑移的逐步增加,由图 4f 和图 4j 放大。(b) 和 (d)显示,随着振动周期数的增加,每个上行段的剪切位移也在增加。
Figures 4c, 4g and 4k shows the amplitude of AE energy released during experiments, and Figures 4d, 4h, and 4l shows the frequency and energy intensity of the AE signal derived from the Fourier transform of Figures 4c, 4g, and 4k. AE results can reflect the state and velocity of motion. Before the vibration started, the sample was in a static state, and there is no AE signal.
图 4c、4g 和 4k 显示了实验过程中释放的 AE 能量的振幅,图 4d、4h 和 4l 显示了从图 4c、4g 和 4k 的傅立叶变换中得出的 AE 信号的频率和能量强度。AE 结果可以反映运动状态和速度。振动开始前,样品处于静止状态,没有 AE 信号。
In the vibration process, the stepwise increase of co-vibration shear displacement was also shown by periodic changes of AE signal and energy in the AE signal diagrams (Figures 4c, 4g and 4k) and time-frequency diagrams (Figures 4d, 4h and 4l). As shown in Figures 4c, 4g, and 4k, the AE signals of upward segments of co-vibration shear displacement have a larger amplitude than the platform segments have.
在振动过程中,AE 信号图(图 4c、图 4g 和图 4k)和时频图(图 4d、图 4h 和图 4l)中的 AE 信号和能量的周期性变化也显示了共振剪切位移的逐步增加。如图 4c、4g 和 4k 所示,共振剪切位移上行段的 AE 信号振幅比平台段的大。
Figures 4d, 4h, and 4l also show that the frequencies of upward segments have a much larger energy intensity than the platform segments in the frequency range of $0–50\text{ kHz}$, and also have a larger energy intensity in the range of $90–150\text{ kHz}$ (Figure 6a).
图 4d、4h 和 4l 还显示,在 $0-50\text{ kHz}$ 的频率范围内,上行段频率的能量强度远大于平台段,在 $90-150\text{ kHz}$ 的频率范围内,上行段频率的能量强度也较大(图 6a)。
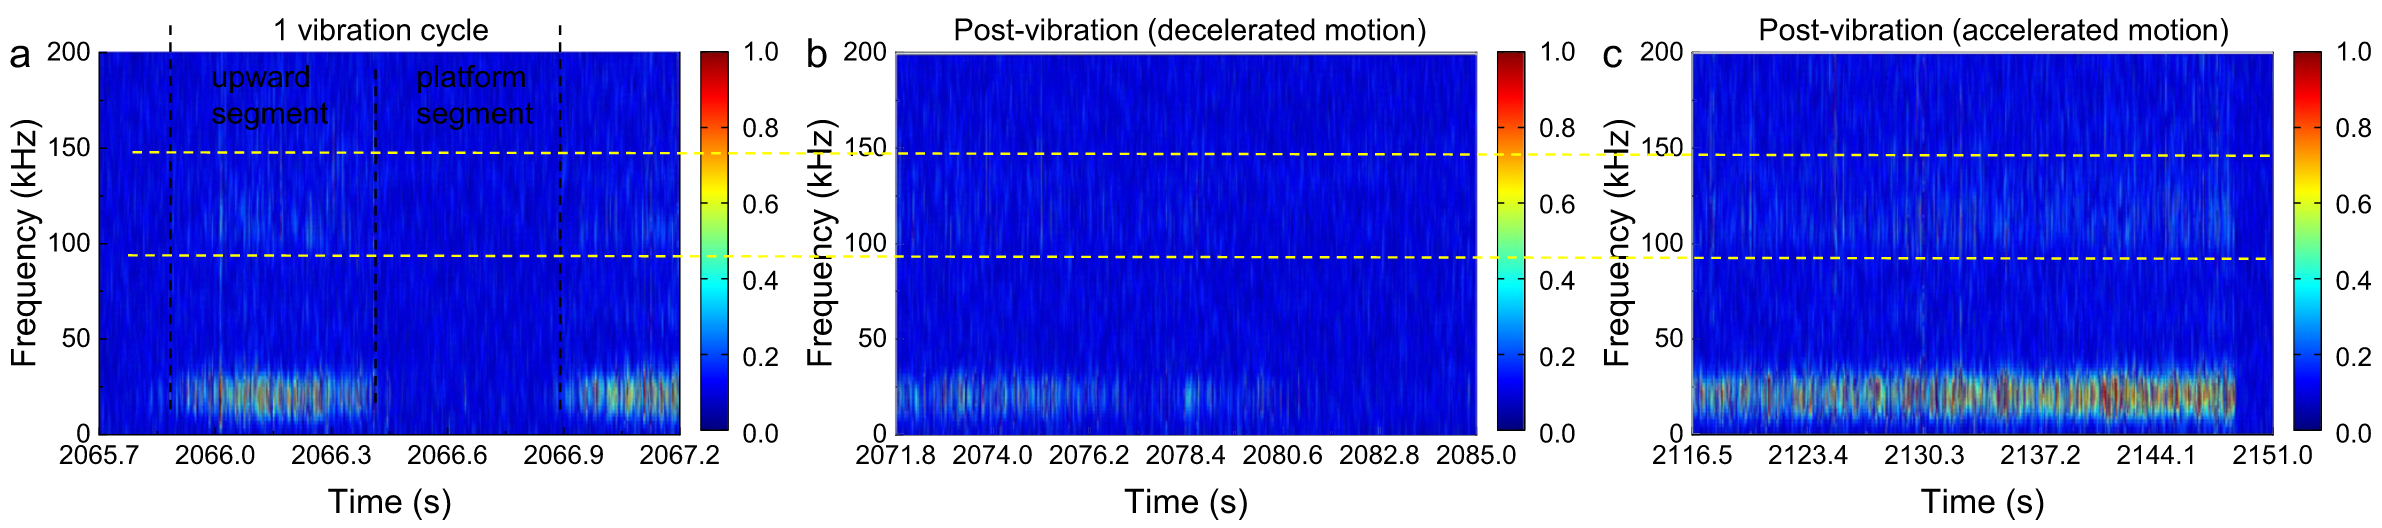
Acoustic emission time-frequency diagrams. (a) The time-frequency diagram during vibration, enlarged from Figure 4h. Black dashed line shows the upward segment and platform segment in a cycle of vibration. (b) The time-frequency diagram after vibration, enlarged from Figure 4h. (b) The time-frequency diagram after vibration, enlarged from Figure 4i. Yellow dashed line shows the frequency range of the high-frequency signal.
声发射时频图。(a) 根据图 4h 放大的振动过程时频图。黑色虚线表示振动周期中的上升段和平台段。(b) 根据图 4h 放大的振动后的时间频率图。(b) 根据图 4i 放大的振动后时间频率图。黄色虚线表示高频信号的频率范围。
Figures 6b and 6c shows that the time-frequency of post-vibration motion is completely different from that of the vibration process. For the post-vibration motion that decelerated and eventually stopped, the corresponding AE signals also gradually weakened and disappeared, while there was no high frequency signal (Figure 6b). For the post-vibration motion that accelerated, the corresponding AE signals gradually became stronger, and had a high frequency signal that gradually increased with time (Figure 6c).
图 6b 和 6c 显示,振动后运动的时间频率与振动过程的时间频率完全不同。对于减速并最终停止的振动后运动,相应的 AE 信号也逐渐减弱并消失,同时没有高频信号(图 6b)。对于加速的振动后运动,相应的 AE 信号逐渐变强,并且随着时间的推移,高频信号逐渐增加(图 6c)。
It was observed that low-frequency (few tens of kHz) AEs are generated during grain friction, while grain collision and crushing excites high-frequency (hundreds of kHz) AEs (Lin et al., 2019; Mao et al., 2018; Michlmayr & Cohen, 2014). While no grain breakage was observed after our tests, in fact, during the co-vibration slip, the acoustic signals with low frequency were mostly from the friction of particles. For the post-vibration slip of decelerated motion (Figure 6a), the acoustic signals with low frequency were also from inter-particle friction (Figure 6b). However, for the post-vibration slip with accelerated motion, the acoustic signals with high frequency were from the collision of the particles during rapid shearing (Figure 6c).
据观察,在颗粒摩擦过程中会产生低频(几十 $\text{ kHz}$)声发射信号,而颗粒碰撞和破碎则会激发高频(几百 $\text{ kHz}$)声发射信号(Lin 等人,2019 年;Mao 等人,2018 年;Michlmayr & Cohen,2014 年)。虽然在我们的试验后没有观察到颗粒破碎,但事实上,在共振滑移过程中,低频声学信号主要来自颗粒的摩擦。对于减速运动的后振动滑移(图 6a),低频声学信号也来自颗粒间的摩擦(图 6b)。然而,在加速运动的振动后滑移中,高频率的声学信号来自颗粒在快速剪切过程中的碰撞(图 6c)。
We counted the energy amplitudes corresponding to the frequencies in each upward segment of three sets of cyclic shear loading tests with different numbers of cycles (Figure 7). The results show that the intensity of acoustic frequency of upward segments increased with the increase in the number of vibration cycles in the frequency range of $0–50\text{ kHz}$ (Figures 7b, 7d, and 7f), and the high frequency ($90–150\text{ kHz}$) signal gradually becomes stronger (Figures 7a, 7c, and 7e).
我们统计了三组不同循环次数的循环剪切加载试验中每个上行段频率对应的能量幅值(图 7)。结果表明,在 $0-50\text{ kHz}$ 的频率范围内,上行段的声频强度随着振动循环次数的增加而增加(图 7b、7d 和 7f),高频($90-150\text{ kHz}$)信号逐渐变强(图 7a、7c 和 7e)。
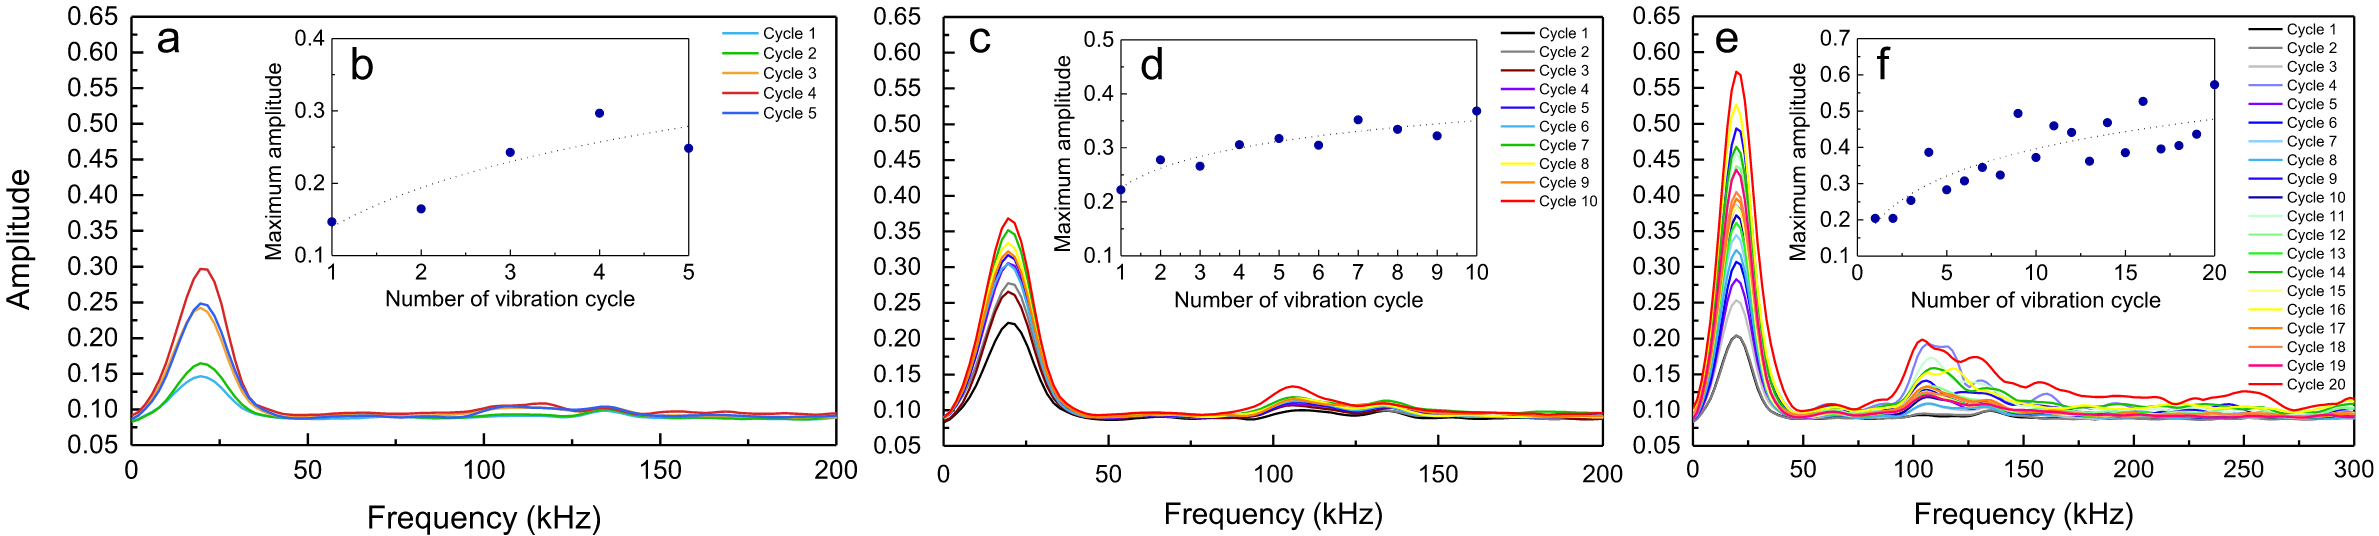
Variation of AE frequency and energy amplitude of upward segments with the number of vibration cycles (Test 1 to Test 3). (a), (c), (e) are the graphs of AE energy and frequency changes in the upward segments of each vibration cycle in tests 1–3. (b), (d), and (f) are the graphs of the variations of the frequency energy peaks corresponding to each upward segment, in the frequency range $0–50\text{ kHz}$.
上行段的 AE 频率和能量振幅随振动周期数的变化(试验 1 至试验 3)。(a)、(c)、(e) 是测试 1-3 中每个振动周期向上段的 AE 能量和频率变化图。 (b)、(d)、(f) 是每个向上段对应的频率能量峰值在频率范围 $0-50\text{ kHz}$ 内的变化图。
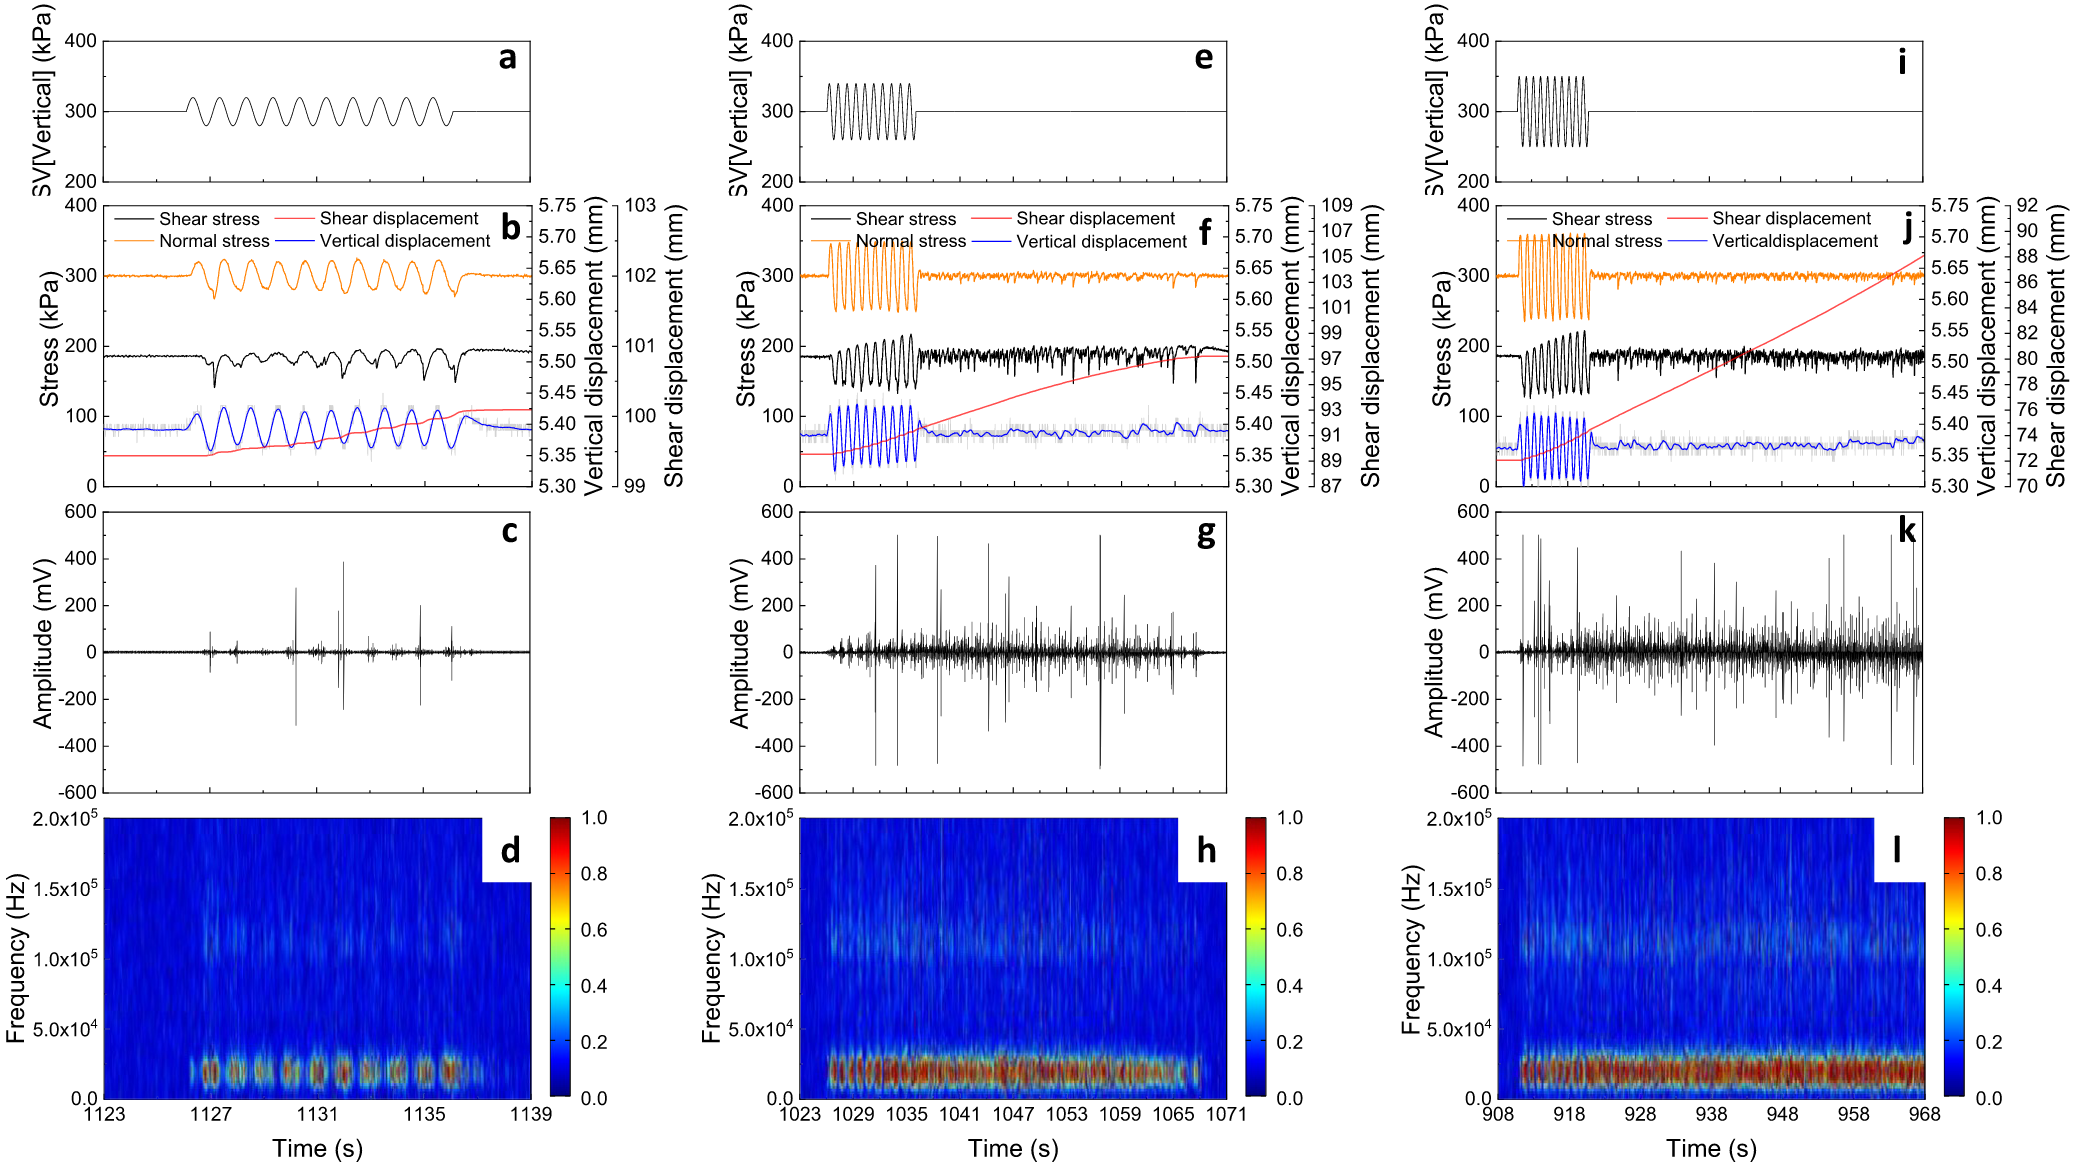
We next applied dynamic normal loads of different numbers of cycles with an amplitude of $20\text{ kPa}$ and a frequency of $1\text{ Hz}$ under $300\text{ kPa}$ normal stress, and $172\text{ kPa}$ SS (Test 4 to Test 6). The peak shear strength of the sample was $189\text{ kPa}$ (PSS), and the ratio of SS to PSS was $0.91$.
接下来,我们在 $300\text{ kPa}$ 法向应力和 $172\text{ kPa}$ SS(试验 $4$ 至试验 $6$)下施加了不同循环次数、振幅为 $20\text{ kPa}$、频率为 $1\text{ Hz}$ 的动态法向载荷。试样的峰值剪切强度为 $189\text{kPa}$(PSS),SS 与 PSS 之比为 $0.91$。
We obtained the same result: a larger number of cycles of dynamic normal load produced a larger co-vibration shear displacement and post-vibration shear displacement and could trigger instability. The difference was that vibrating normal stress caused fluctuations of the SS and vertical displacement synergistically (Figures 8b, 8f, and 8j).
我们得到了相同的结果:动态法向载荷的循环次数越多,产生的共振剪切位移和振后剪切位移就越大,并可能引发不稳定性。不同的是,振动法向应力会协同引起 SS 和垂直位移的波动(图 8b、8f 和 8j)。
The shear displacement also showed a stepwise increase; however, in the dynamic normal load experiments, the upward segments of shear displacement corresponded to the trough segments of cyclic normal stress (Figures 8b, 8f, and 8j), which was the opposite to the results of the dynamic shear loads experiments (Figures 4b, 4f, and 4j).
剪切位移也呈阶梯式上升;然而,在动态法向载荷实验中,剪切位移的上升段与循环法向应力的低谷段相对应(图 8b、8f 和 8j),这与动态剪切载荷实验的结果相反(图 4b、4f 和 4j)。
This shows the different dynamic response mechanisms of effective normal stress reduction and particle dilation. In the dynamic normal load experiments, as the number of vibration cycles increased, the platform segments gradually transformed into upward segments which have a smaller slope than upward segments have (Figures 8f and 8j).
这显示了等效法向应力减小和颗粒扩张的不同动态响应机制。在动态法向载荷实验中,随着振动循环次数的增加,平台段逐渐转变为向上段,其斜率小于向上段(图 8f 和 8j)。
Cyclic normal loading tests at different numbers of cycles under 300 kPa normal stress and 172 kPa shear stress (Test 4 to Test 6). (a), (e), (i) are the graphs of the input sinusoidal dynamic load, the amplitude is 20 kPa, the frequency is 1 Hz, the number of cycles is 5,10, and 40, respectively. (b), (f), (j) are the graphs of experimental results, showing the change in normal stress (orange line), shear stress (black line), shear displacement (red line), and vertical displacement (blue line). (c), (g), and (k) are diagrams of acoustic emission original signals during the experiment. (d), (h), and (l) are acoustic emission time-frequency diagrams during the experiment. In e, f, g, and h, the green rectangle shows the platform segment of shear displacement, and the purple rectangle shows the upward segment.
在 $300\text{ kPa}$ 法向应力和 $172\text{ kPa}$ 剪切应力作用下进行的不同循环次数的循环法向加载试验(试验 4 至试验 6)。(a)、(e)、(i)分别为输入正弦动载荷图,振幅为 $20\text{ kPa}$,频率为 $1\text{ Hz}$,循环次数分别为 5、10 和 40。(b)、(f)、(j) 为实验结果图,显示法向应力(橙色线)、剪应力(黑色线)、剪切位移(红色线)和垂直位移(蓝色线)的变化。 (c)、(g) 和 (k) 是实验过程中的声发射原始信号图。(d)、(h) 和 (l) 是实验过程中的声发射时频图。在 e、f、g 和 h 中,绿色矩形表示剪切位移的平台段,紫色矩形表示上升段。
Similar experimental results were obtained under $100\text{ kPa}$ (Figures S2 and S3, Test 7 to Test 12 in Supporting Information S1) and $500\text{ kPa}$ (Figures S4 and S5, Test 13 to Test 18 in Supporting Information S1) normal stresses.
在 $100\text{ kPa}$ (图 S2 和 S3,测试 7 至测试 12,见佐证资料 S1)和 $500\text{ kPa}$ (图 S4 和 S5,测试 13 至测试 18,见佐证资料 S1)法应力下也得到了类似的实验结果。
A larger number of vibration cycles can cause larger co-vibration and post-vibration shear displacement, and are more likely to trigger instability in the samples.
振动次数越多,共振和振后剪切位移越大,越容易引发样品的不稳定性。
Figure 9 presents the changes in shear displacement of each upward segment from test 1 to test 18. It shows that the shear displacement of each upward segment increased with an increase in the number of vibration cycles in both dynamic shear load and dynamic normal load experiments under $100\text{ kPa}$, $300\text{ kPa}$, and $500\text{ kPa}$ normal stress (Figure 9). Figure 10 shows that the post-vibration shear displacement also increased with the increase in the number of vibration cycles, and instability occurred eventually.
图 9 显示了从试验 1 到试验 18 每个上行段的剪切位移变化。从图中可以看出,在 $100\text{ kPa}$、$300\text{ kPa}$ 和 $500\text{ kPa}$ 法向应力下,无论是动剪切载荷试验还是动法向载荷试验,每个上行段的剪切位移都随着振动周期数的增加而增加(图9)。图 10 显示,振动后的剪切位移也随着振动循环次数的增加而增加,最终出现不稳定。
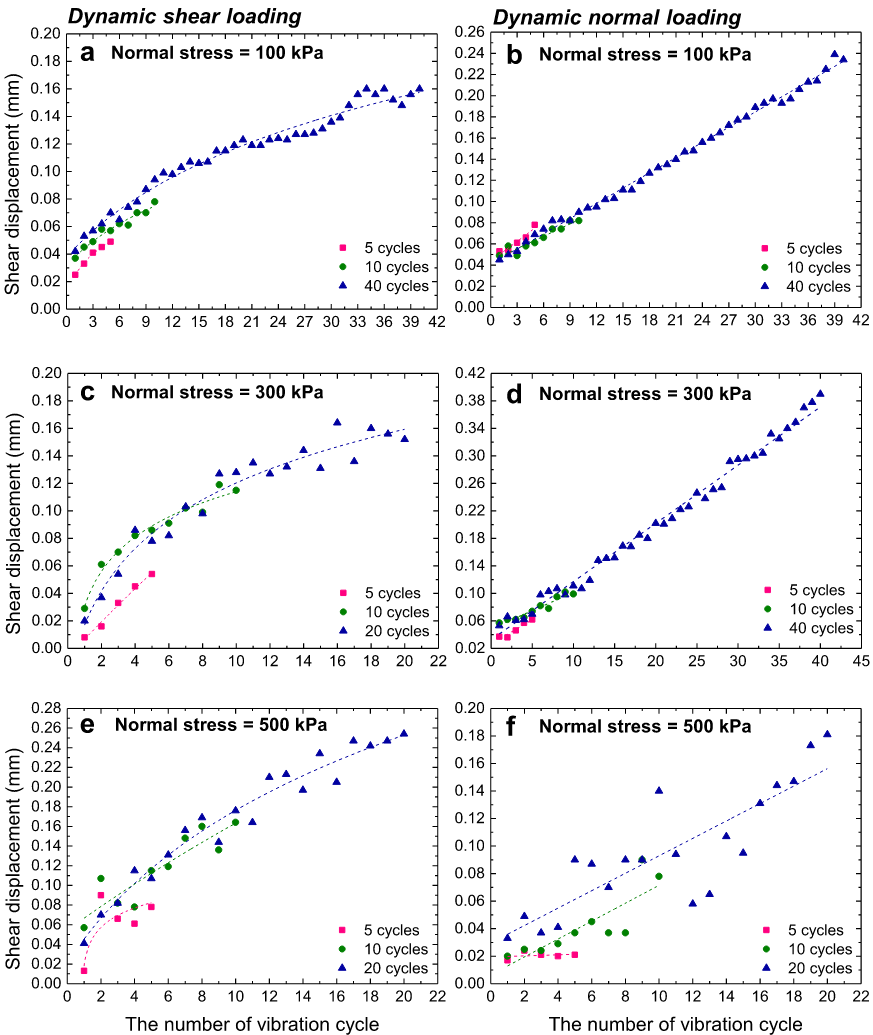
The changes of shear displacement of each upward segment with increases in the number of vibration cycles in dynamic shear load experiments and dynamic normal load experiments under $100\text{ kPa}$, $300\text{ kPa}$, and $500\text{ kPa}$ normal stress. (a), (b) The shear displacement of each upward segment increased with the increase in the number of vibration cycles in both dynamic shear load experiments (a) and dynamic normal load experiments (b). (c), (d) The shear displacement of each upward segment increased with the increase in the number of vibration cycles in both the dynamic shear load experiments (c) and dynamic normal load experiments (d). (e), (f) The shear displacement of each upward segment increased with the increase in the number of vibration cycles in both the dynamic shear load experiments (e) and dynamic normal load experiments (f).
在 $100\text{ kPa}$、$300\text{ kPa}$ 和 $500\text{ kPa}$ 法向应力下进行的动态剪切荷载实验和动态法向荷载实验中,随着振动循环次数的增加,每个上行段的剪切位移发生了变化。(a),(b)在动态剪切载荷实验(a)和动态法向载荷实验(b)中,随着振动周期数的增加,每个上行段的剪切位移都在增加。 (c)、(d) 在动态剪切载荷实验 (c) 和动态法向载荷实验 (d) 中,随着振动循环次数的增加,每个向上区段的剪切位移都在增加。(e)、(f) 在动态剪切荷载实验(e)和动态法向荷载实验(f)中,随着振动循环次数的增加,每个向上区段的剪切位移都在增加。
These results indicate that the shear strength of granular materials may show a duration-dependent dynamic weakening under different normal stresses of $100\text{ kPa}$, $300\text{ kPa}$, and $500\text{ kPa}$. The increase of shear displacement of each upward segment roughly followed a logarithmic law in the dynamic shear loads experiments (Figures 9a, 9c and 9e), and linearity in the dynamic normal loads experiments (Figures 9b, 9d and 9f).
这些结果表明,在 $100\text{ kPa}$、$300\text{ kPa}$ 和 $500\text{ kPa}$ 的不同法向应力作用下,颗粒材料的剪切强度可能会出现随时间变化的动态减弱。在动态剪切荷载实验(图 9a、图 9c 和图 9e)中,每个上行段的剪切位移的增加大致遵循对数规律,而在动态法向荷载实验(图 9b、图 9d 和图 9f)中则是线性的。
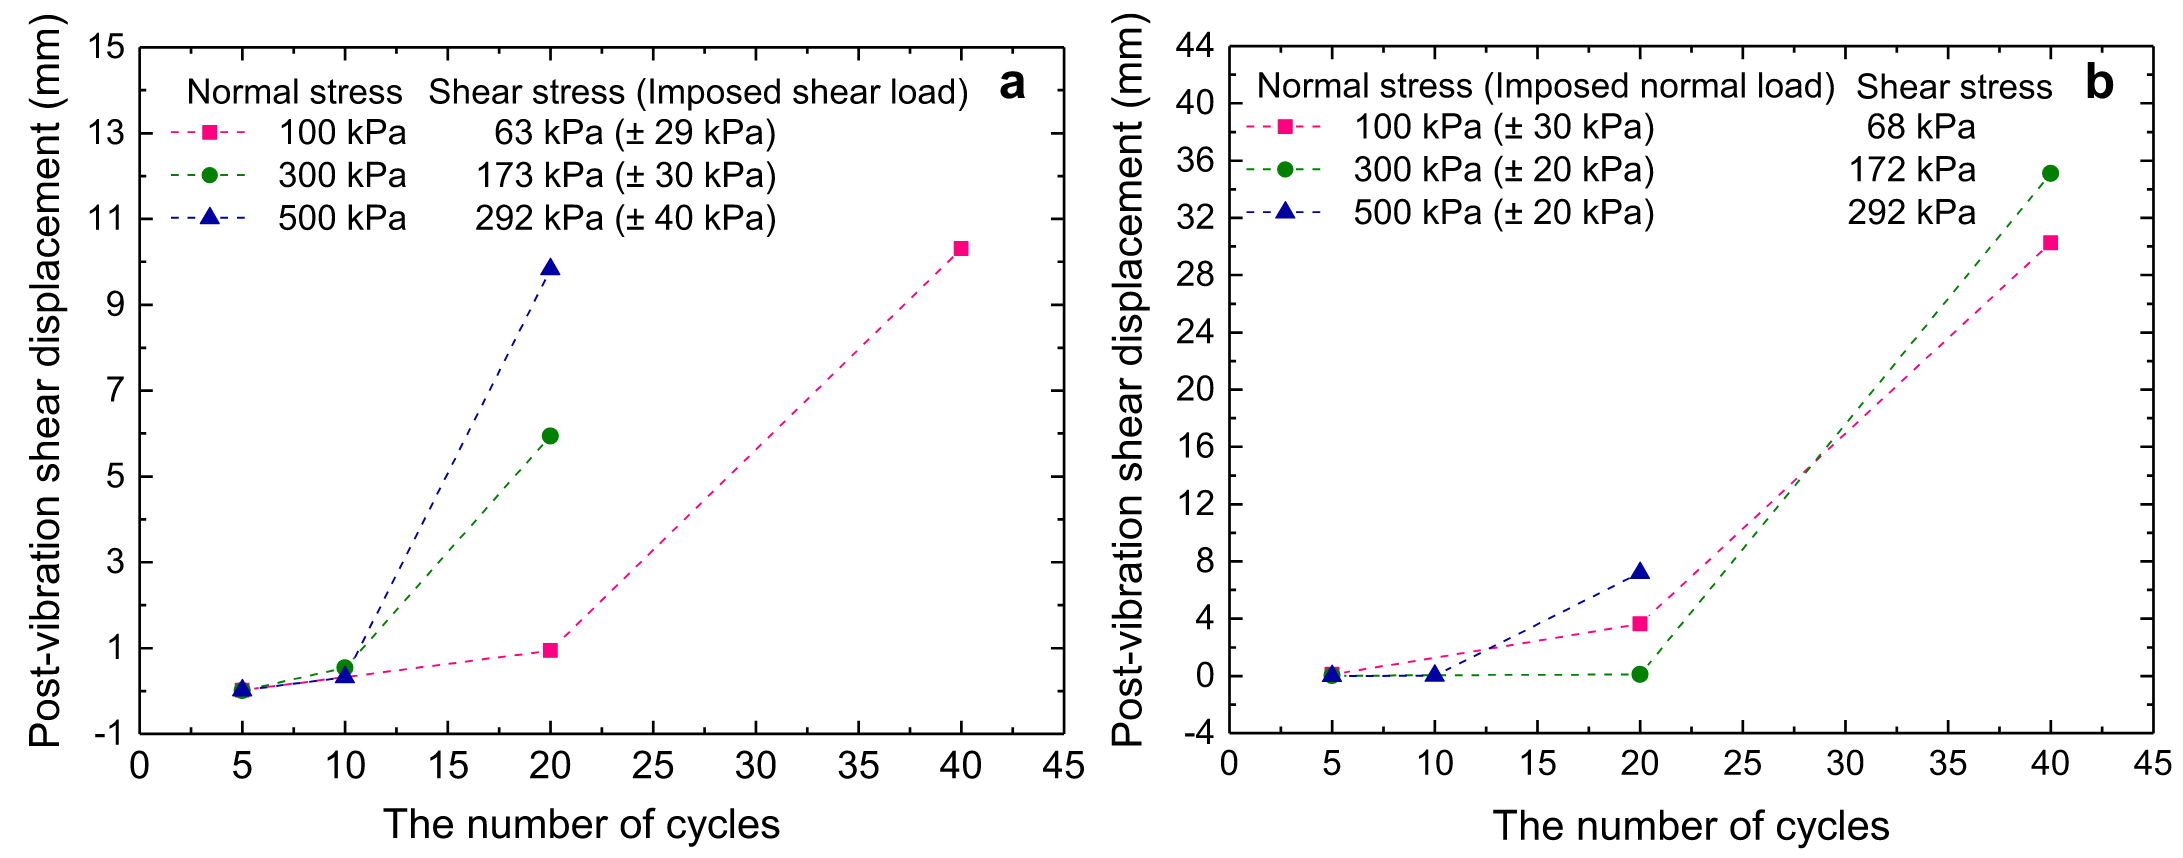
The changes in post-vibration shear displacement with an increase in the number of vibration cycles in dynamic shear load experiments and dynamic normal load experiments under $100\text{ kPa}$, $300\text{ kPa}$, and $500\text{ kPa}$ normal stress. (a) The post-vibration shear displacement increased with the increase in the number of vibration cycles in the dynamic shear load experiments (a), and in the dynamic normal load experiments (b).
在 $100\text{ kPa}$、$300\text{ kPa}$ 和 $500\text{ kPa}$ 法向应力下,随着动态剪切载荷实验和动态法向载荷实验中振动周期数的增加,振动后剪切位移的变化。(a) 在动态剪切载荷实验(a)和动态法向载荷实验(b)中,振动后剪切位移随着振动周期数的增加而增加。
Dynamic Ring Shear Experiments With Different Amplitudes
We also studied the influence of amplitude on dynamic triggered sliding. Figure 11 shows the results under different amplitudes of sinusoidal dynamic shear loads with 10 cycles and a frequency of 1 Hz under 300 kPa normal stress and 187 kPa SS (Test 19 to Test 21). The peak shear strength of the sample was 207 kPa (PSS), and the ratio of SS to PSS was 0.9. The results show that the vibration with an amplitude of 40 kPa triggered instability (Figure 11j), while vibrations with amplitudes of 20 and 30 kPa only caused small co-vibration slip of 0.34 and 1.093 mm respectively (Figures 11b and 11f).
我们还研究了振幅对动态触发滑动的影响。图 11 显示了在 $300\text{ kPa}$ 法向应力和 $187\text{ kPa}$ SS 条件下,在 $10$ 个周期、频率为 $1\text{ Hz}$ 的正弦动态剪切载荷的不同振幅下的结果(试验 19 至试验 21)。样品的峰值剪切强度为 $207\text{ kPa}$(PSS),SS 与 PSS 之比为 $0.9$。结果表明,振幅为 $40\text{ kPa}$ 的振动引发了不稳定性(图 11j),而振幅为 $20$ 和 $30\text{ kPa}$ 的振动仅分别引起了 $0.34$ 和 $1.093\text{ mm}$ 的微小共振滑移(图 11b 和 11f)。
Cyclic shear loading tests at different amplitudes under $300\text{ kPa}$ normal stress and $187\text{ kPa}$ shear stress (Test 19 to Test 21). (a), (e), and (i) are the graphs of the input sinusoidal dynamic load, the number of cycles is 10, the frequency is $1\text{ Hz}$, and the amplitudes are $20\text{ kPa}$, $30\text{ kPa}$, and $40\text{ kPa}$, respectively. (b), (f), and (j) are the graphs of experimental results, showing the change of normal stress (orange line), shear stress (black line), shear displacement (red line), and vertical displacement (blue line). (c), (g), and (k) are diagrams of acoustic emission original signals during the experiment. (d), (h), and (l) are acoustic emission time-frequency diagrams during the experiment.
在 $300\text{ kPa}$ 法向应力和 $187\text{ kPa}$ 剪切应力作用下不同振幅的循环剪切加载试验(试验 19 至试验 21)。(a)、(e) 和 (i) 是输入正弦动态载荷的曲线图,循环次数为 10 次,频率为 $1\text{ Hz}$,振幅分别为 $20\text{ kPa}$、$30\text{ kPa}$ 和 $40\text{ kPa}$ 。(b)、(f) 和 (j) 是实验结果图,显示了法向应力(橙色线)、剪切应力(黑色线)、剪切位移(红色线)和垂直位移(蓝色线)的变化。(c)、(g)和(k)是实验过程中的声发射原始信号图。(d)、(h) 和 (l) 为实验过程中的声发射时频图。
Similar results were obtained in the dynamic normal loading tests. Figure 12 shows the results for different amplitudes of sinusoidal dynamic normal loads with 10 cycles and a frequency of 1 Hz under 300 kPa normal stress and 186 kPa SS (Test 22 to Test 24). The peak shear strength of the sample was 204 kPa (PSS), and the ratio of SS to PSS was 0.91. When the amplitude was 20 kPa, the vibration caused only a small co-vibration slip (0.652 mm) (Figure 12b). When the amplitude was 40 kPa, the shear displacement underwent 2.004 mm co-vibration slip and a period of decelerating post-vibration slip (5.678 mm) (Figure 12f). When the amplitude was 50 kPa, the vibration caused instability (Figure 12j).
Cyclic normal loading tests at different amplitudes under $300\text{ kPa}$ normal stress and $186\text{ kPa}$ shear stress (Test 22 to Test 24). (a), (e), and (i) are the graphs of the input sinusoidal dynamic load, the number of cycles is $10$, the frequency is $1\text{ Hz}$, and the amplitude is $20\text{ kPa}$, $40\text{ kPa}$, and $50\text{ kPa}$, respectively. (b), (f), and (j) are the graphs of experimental results, showing the change of normal stress (orange line), shear stress (black line), shear displacement (red line), and vertical displacement (blue line). (c), (g), and (k) are diagrams of acoustic emission original signals during the experiment. (d), (h), and (l) are acoustic emission time-frequency diagrams during the experiment.
在 $300\text{ kPa}$ 的法向应力和 $186\text{ kPa}$ 的剪应力作用下进行的不同振幅的循环法向加载试验(试验 22 至试验 24)。(a)、(e) 和 (i) 分别是输入正弦动态载荷的曲线图,循环次数为 $10$,频率为 $1\text{ Hz}$,振幅分别为 $20\text{ kPa}$、$40\text{ kPa}$ 和 $50\text{ kPa}$ 。 (b)、(f) 和 (j) 为实验结果图,显示法向应力(橙色线)、剪切应力(黑色线)、剪切位移(红色线)和垂直位移(蓝色线)的变化。(c)、(g) 和 (k) 是实验过程中的声发射原始信号图。(d)、(h) 和 (l) 为实验过程中的声发射时频图。